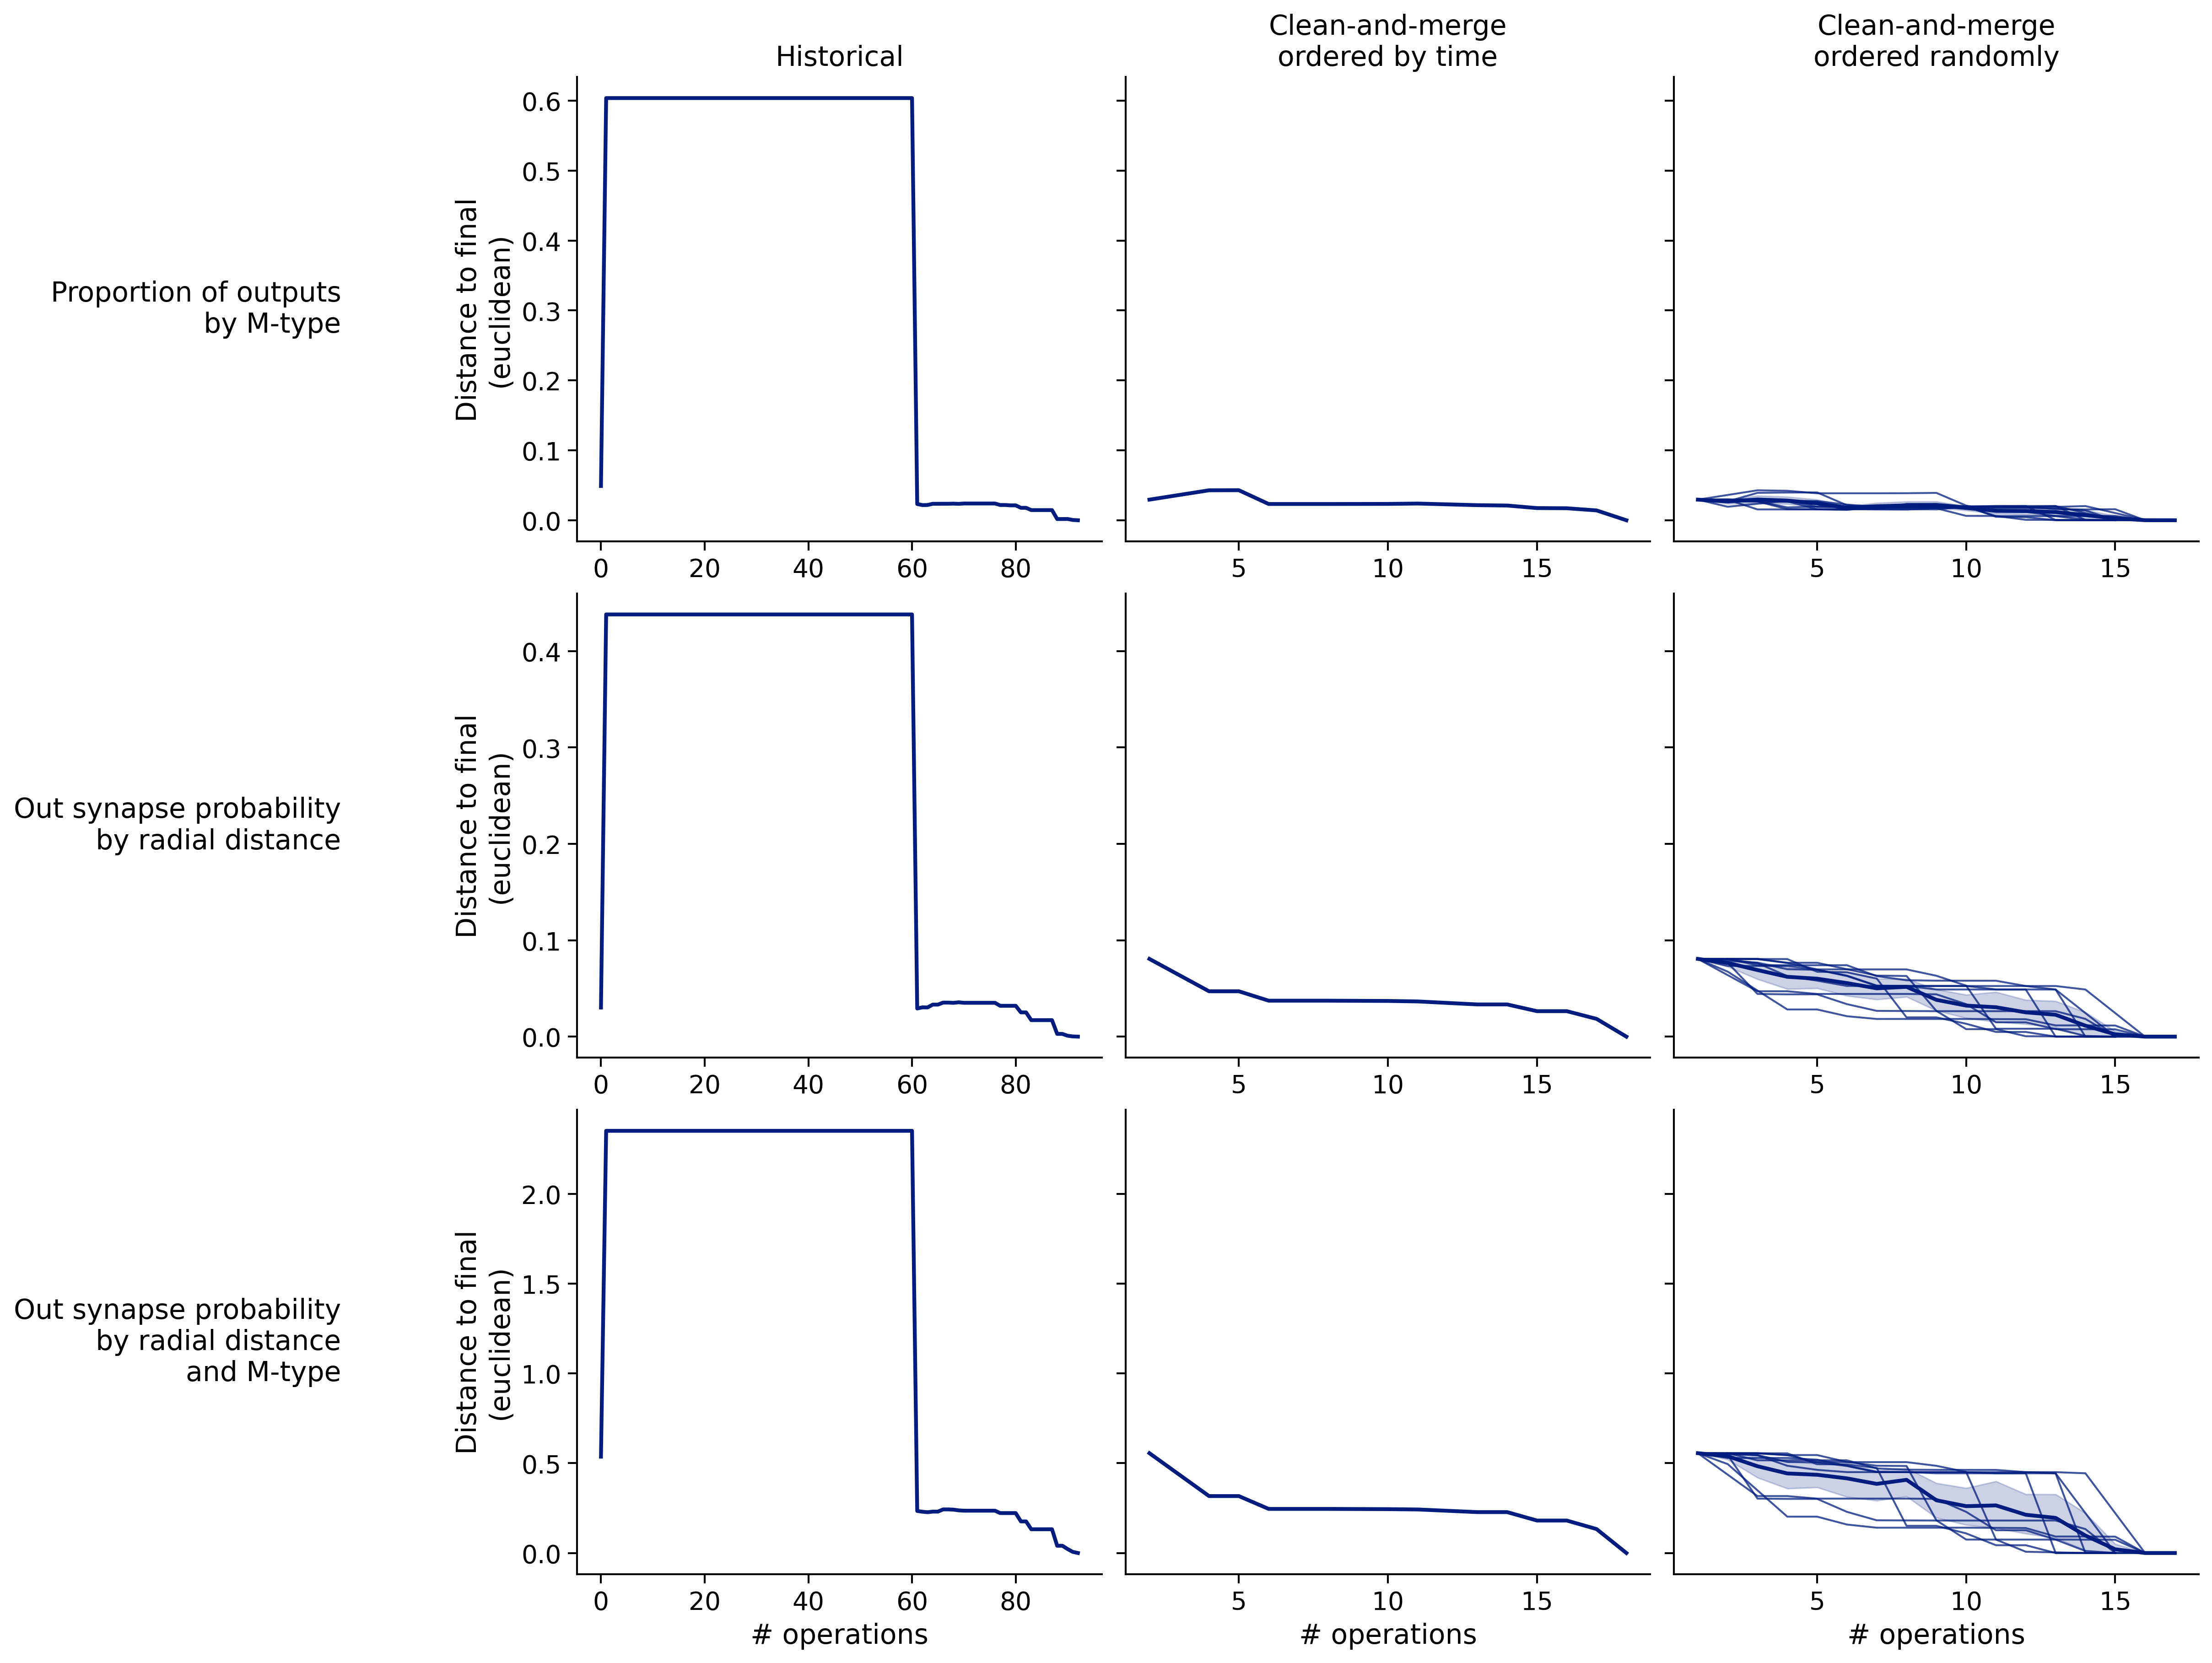
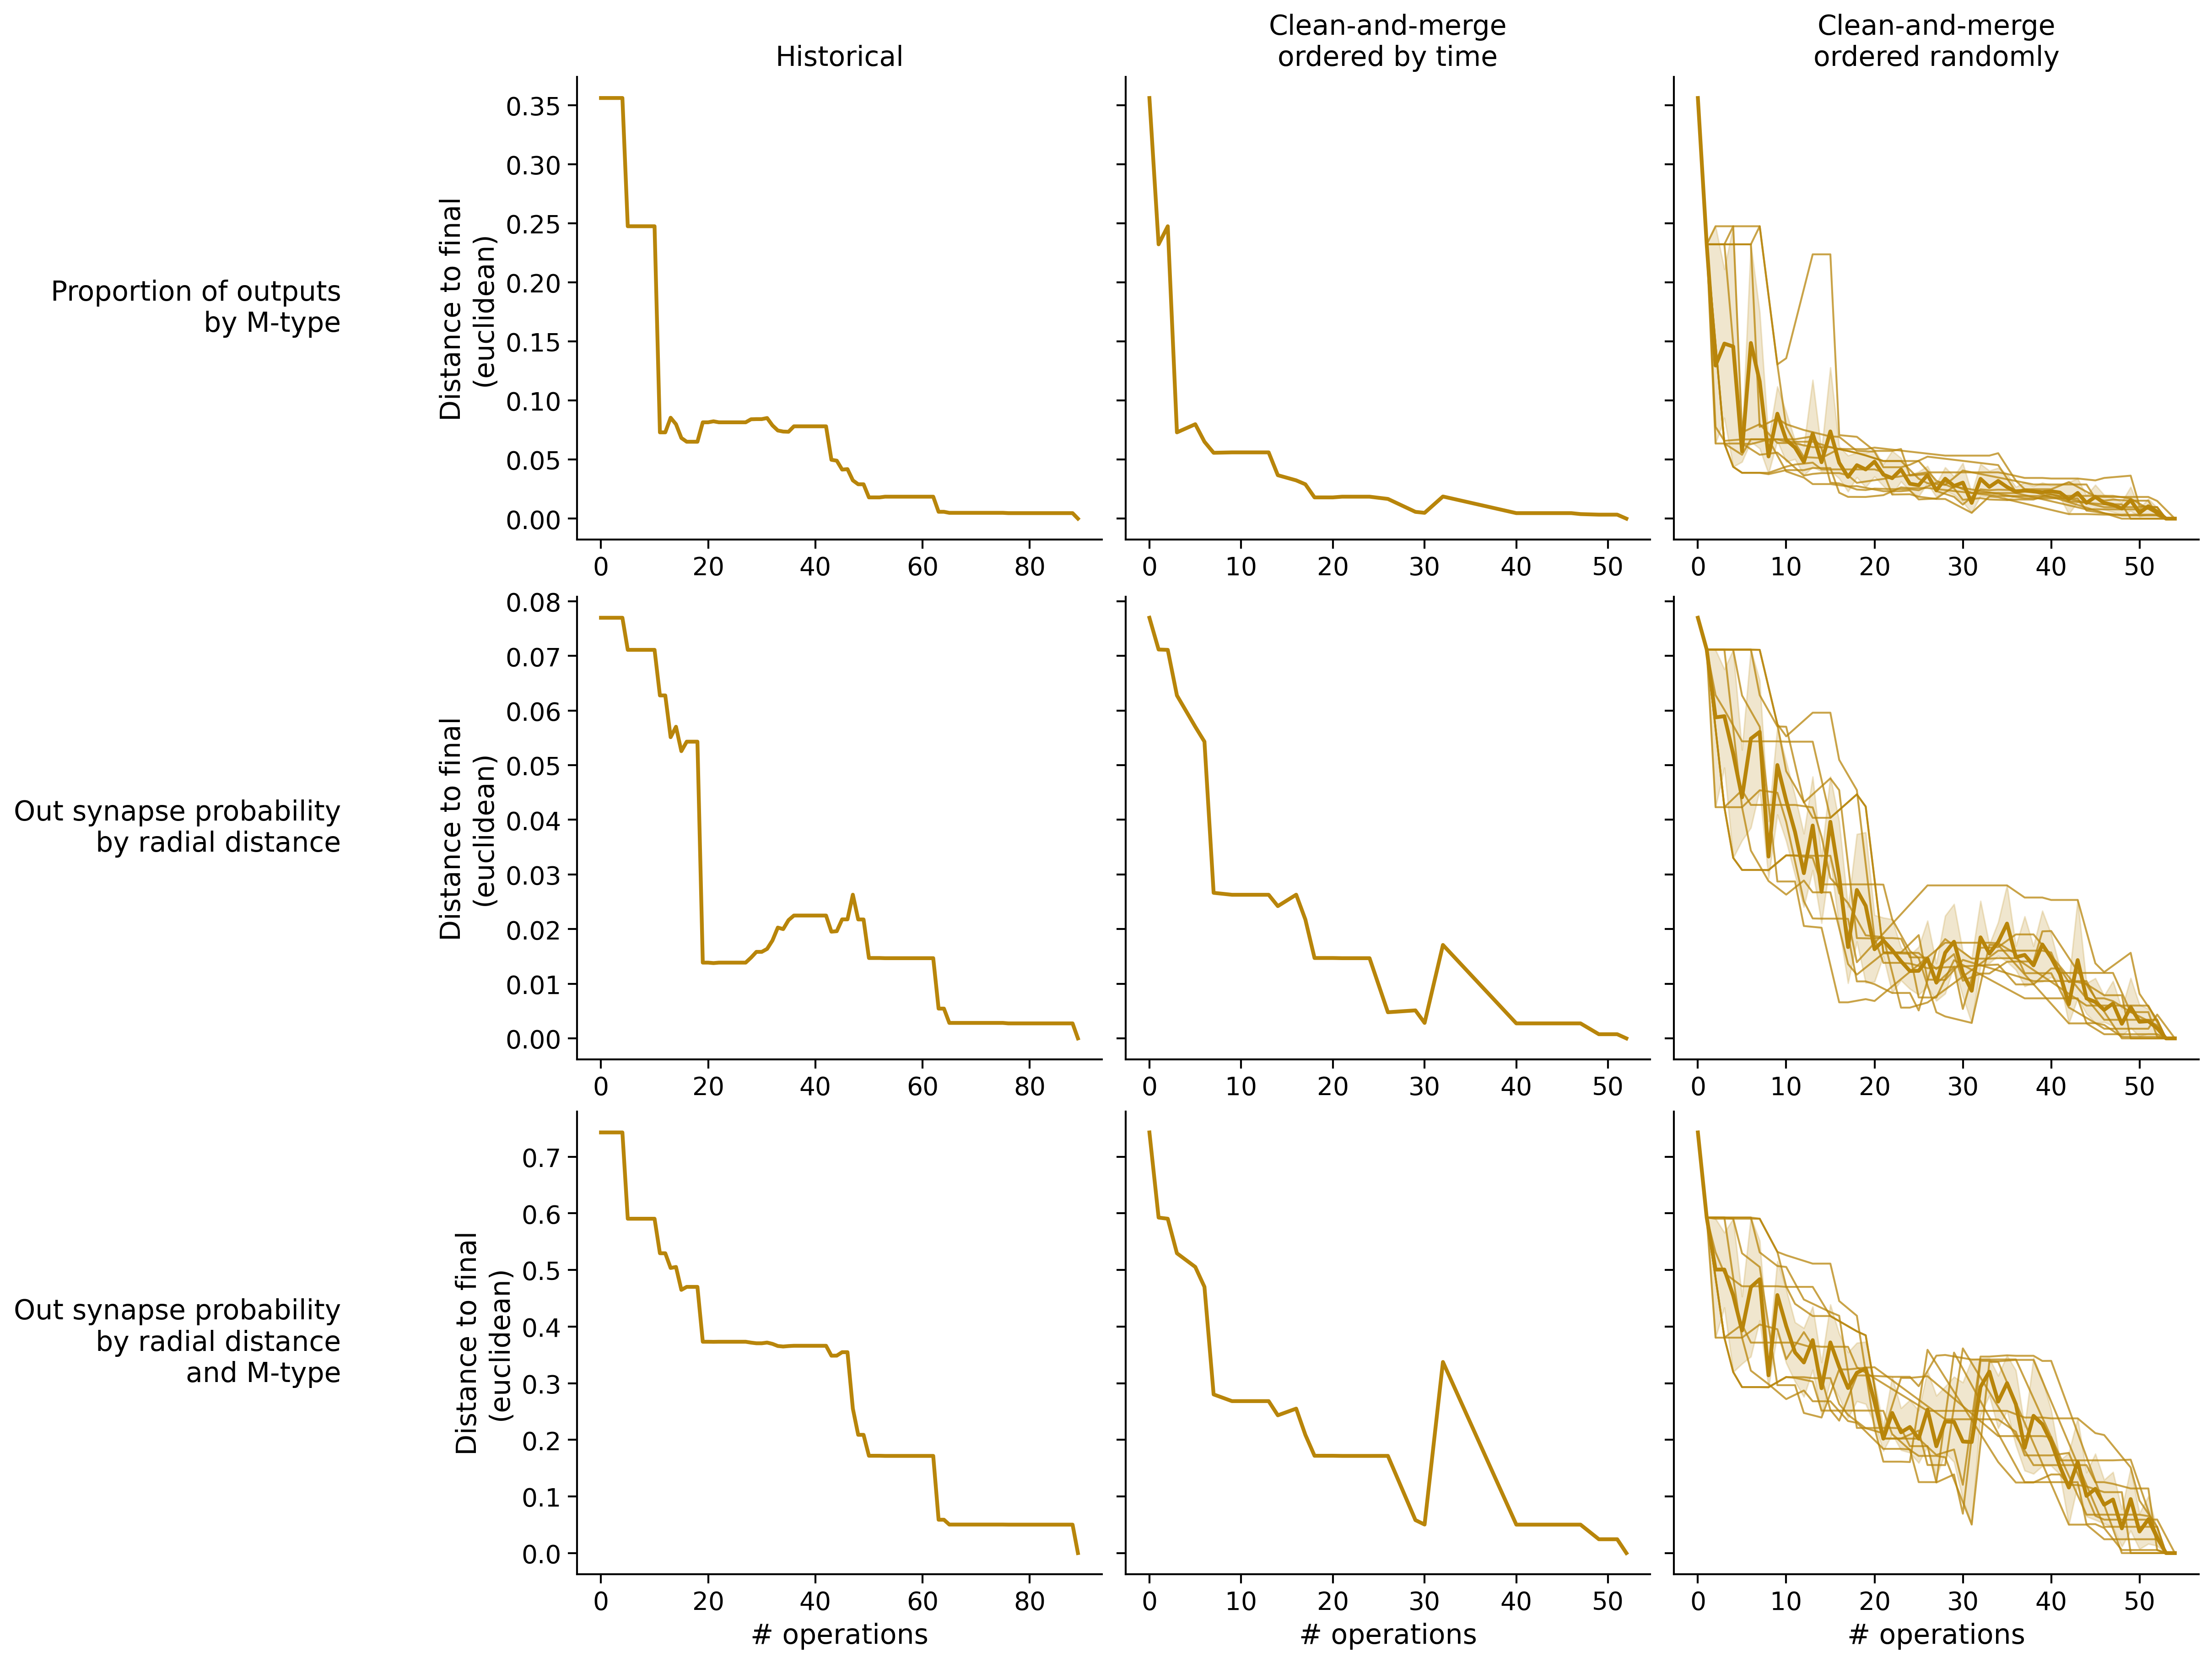
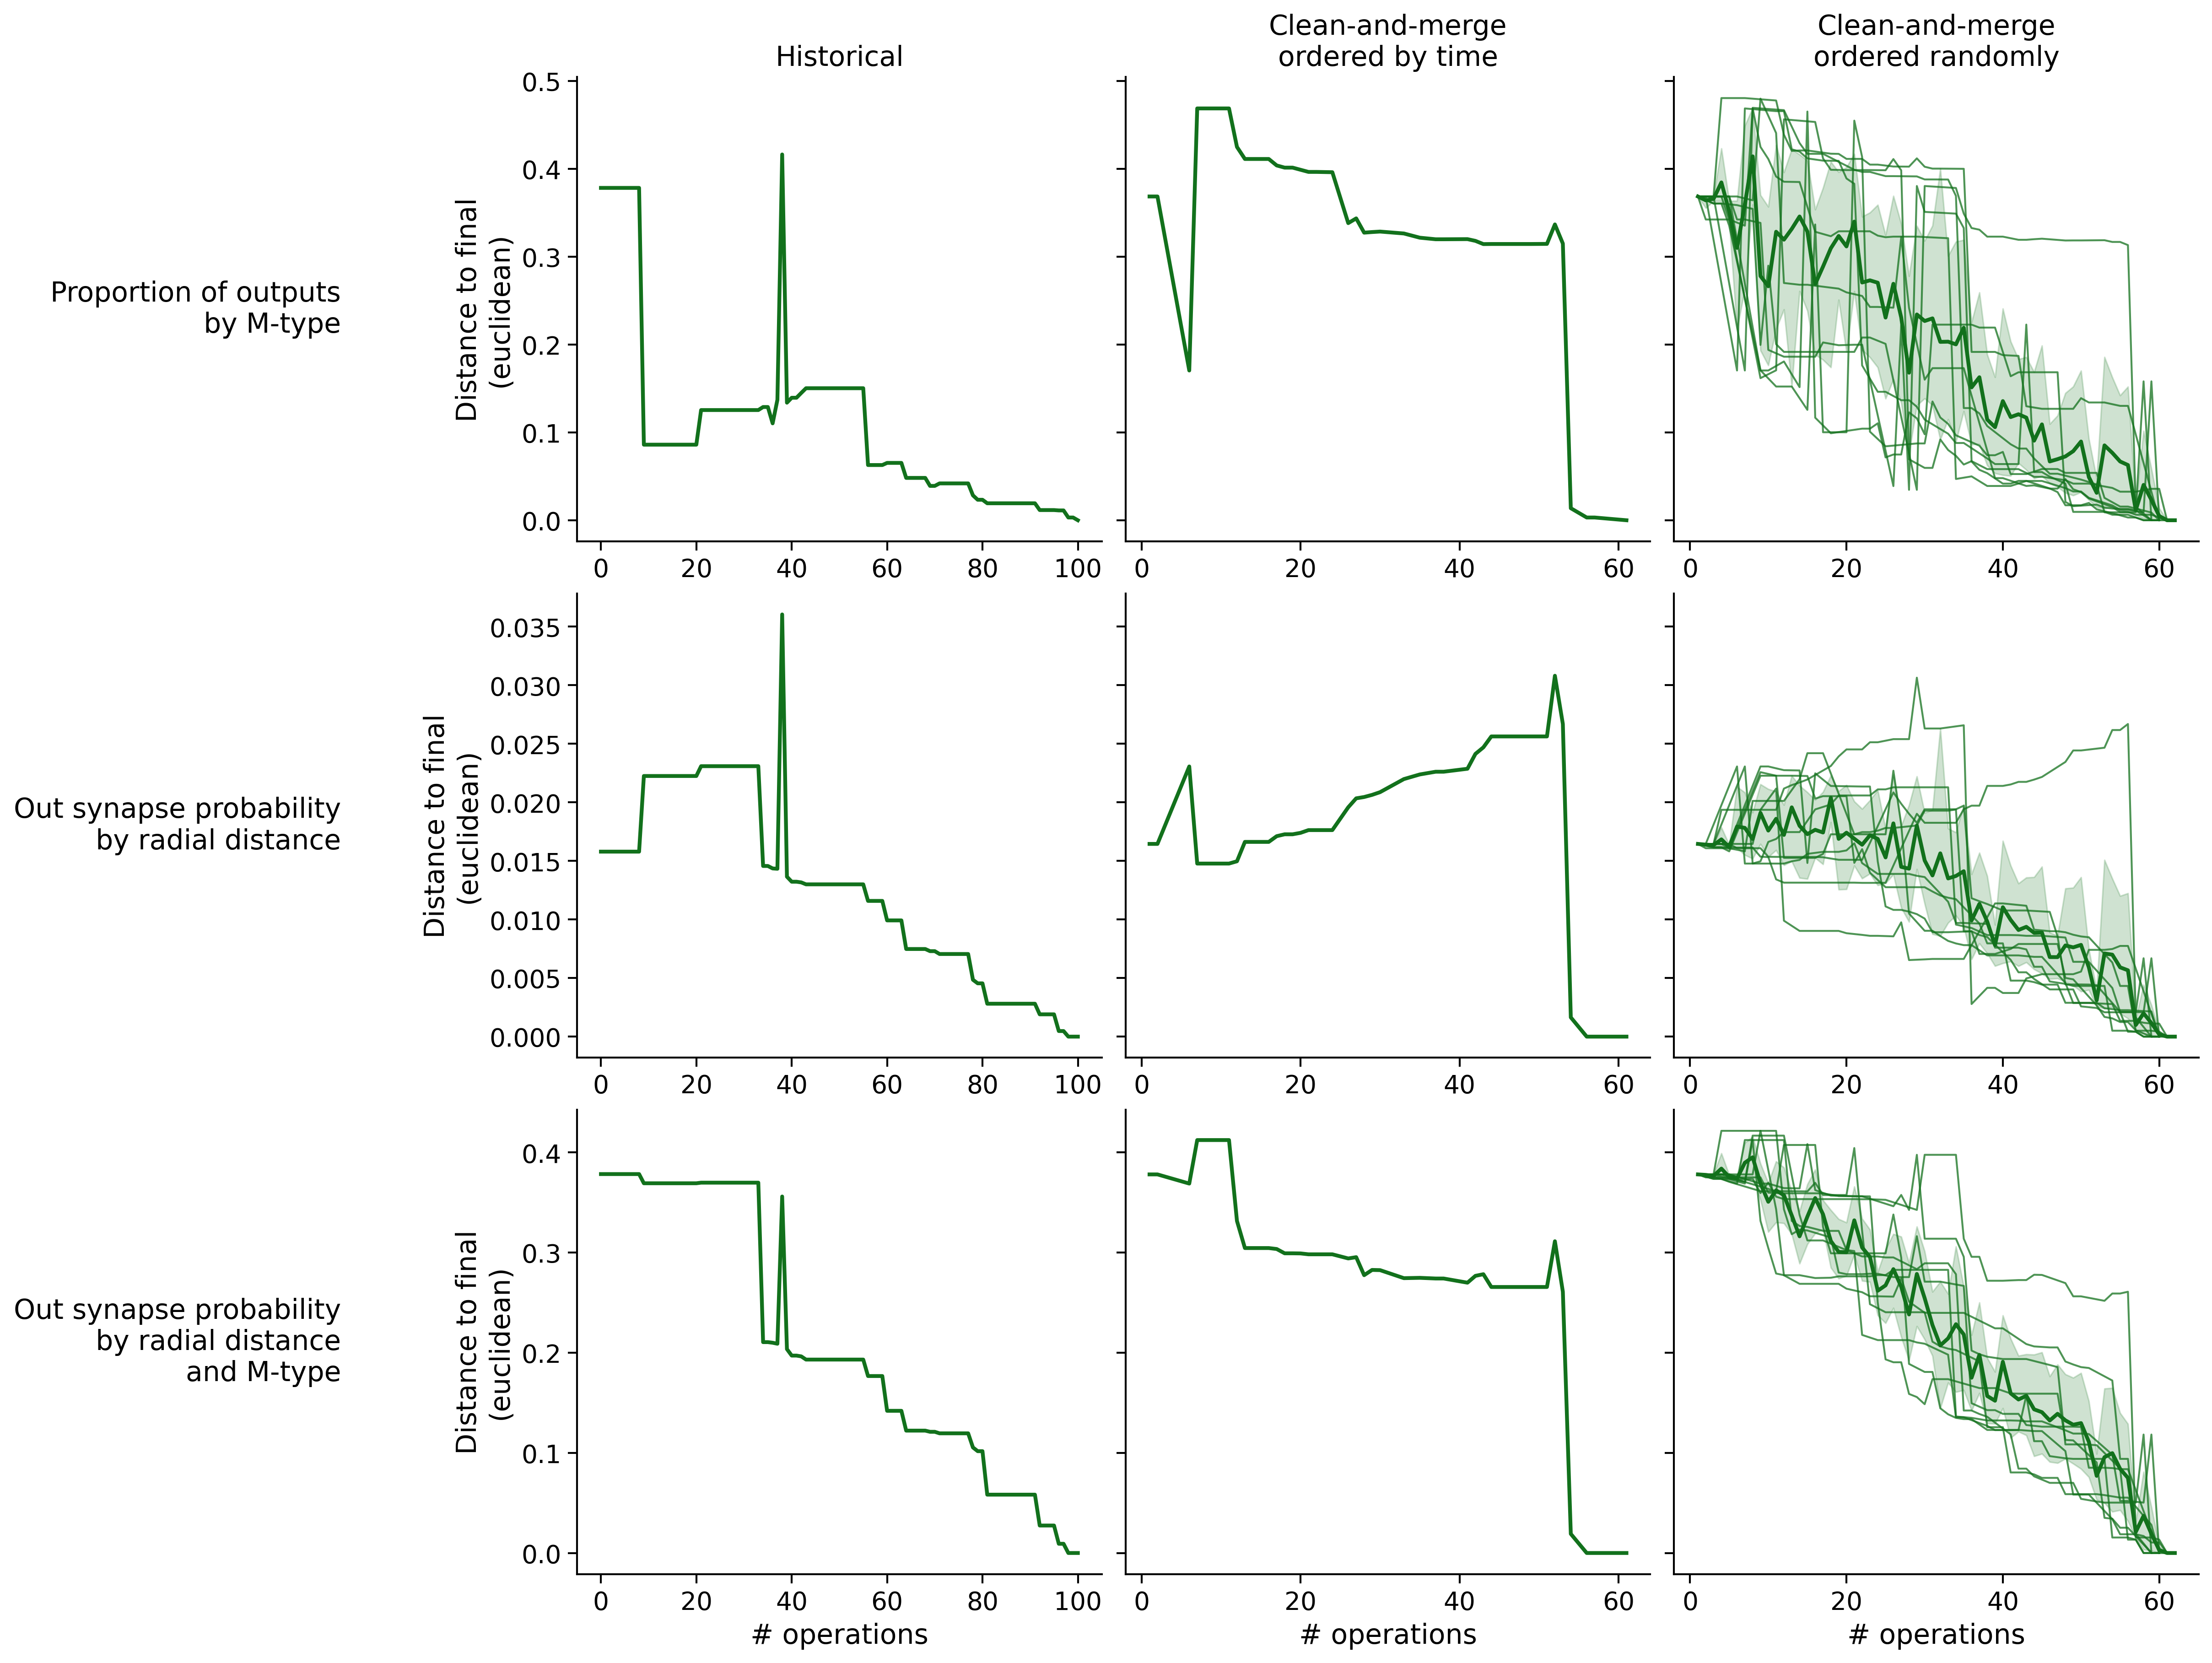
Neuron-wise statistics
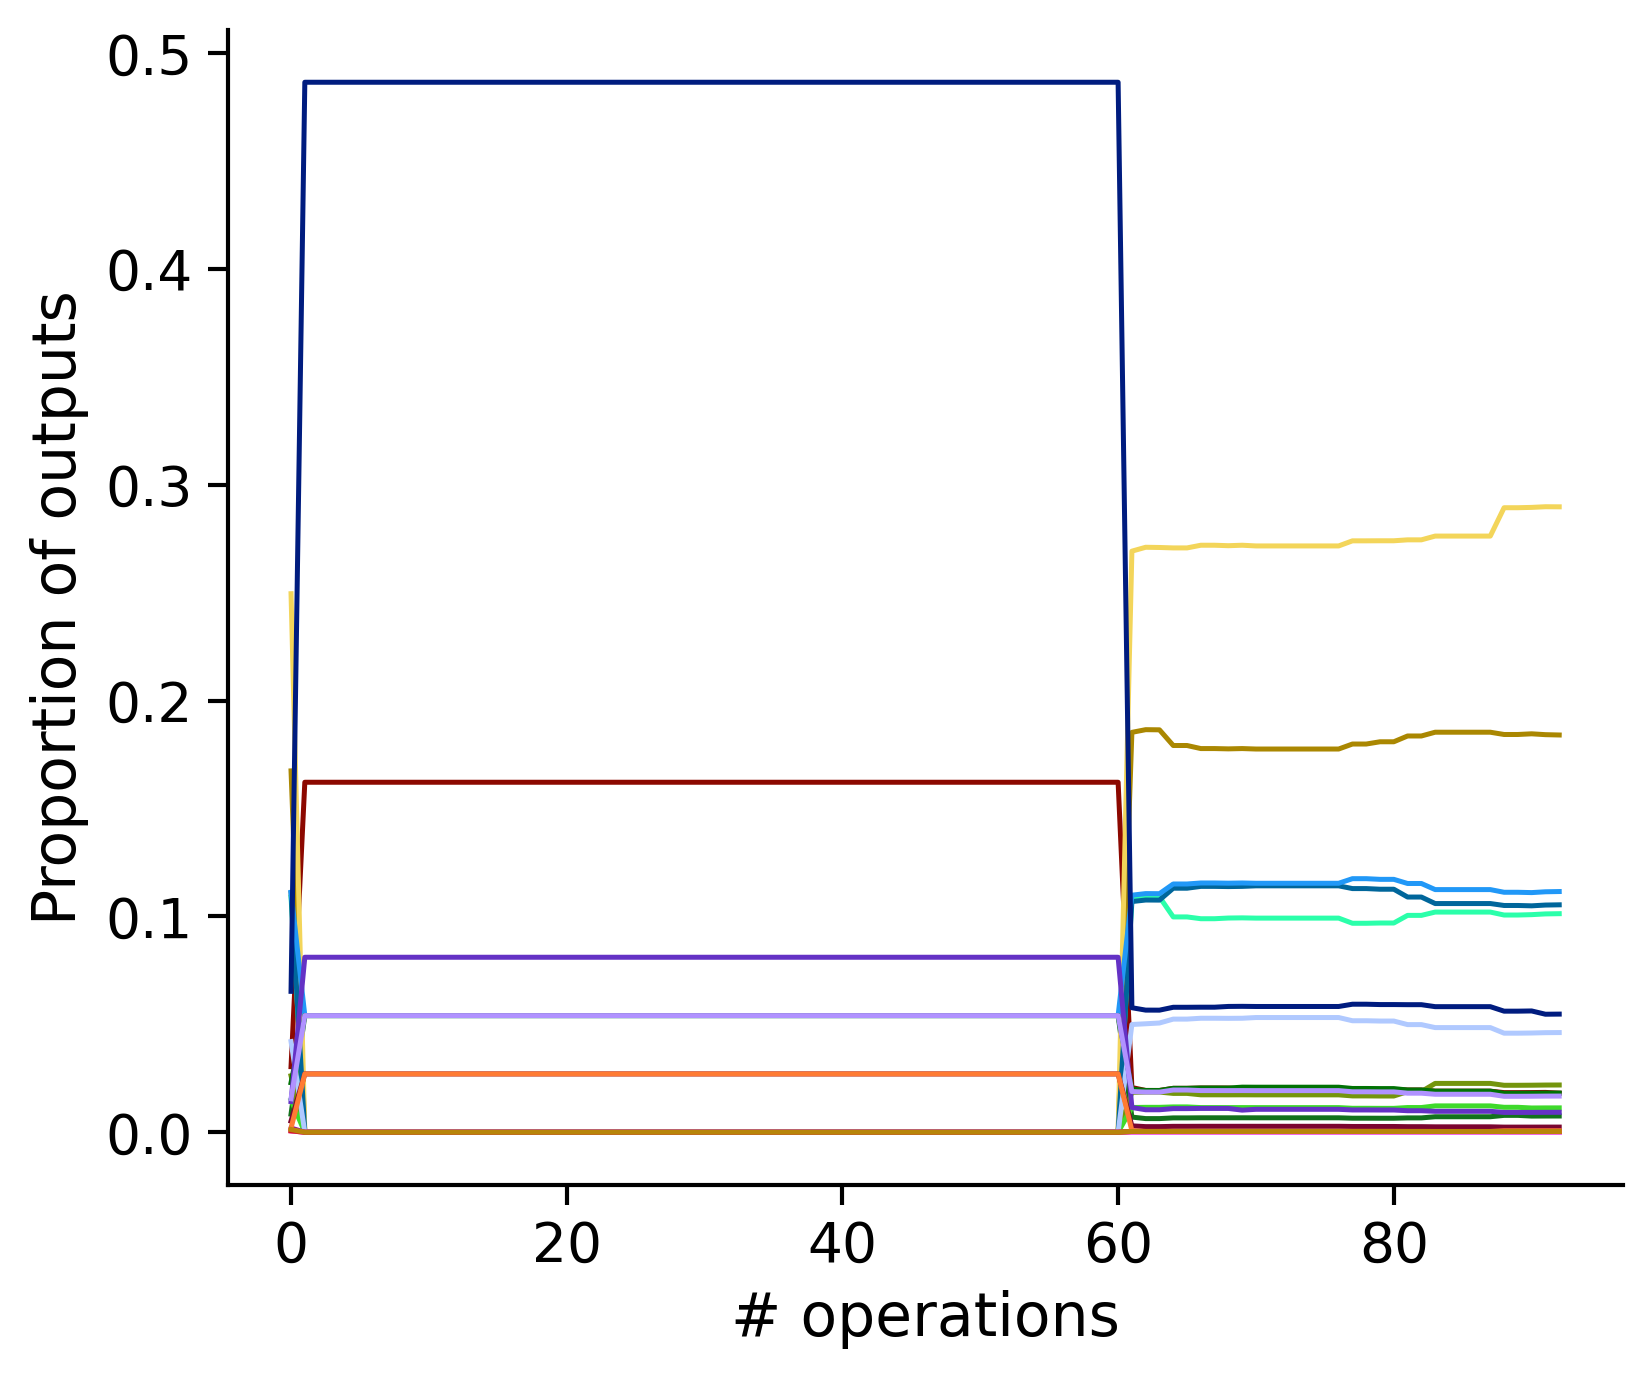
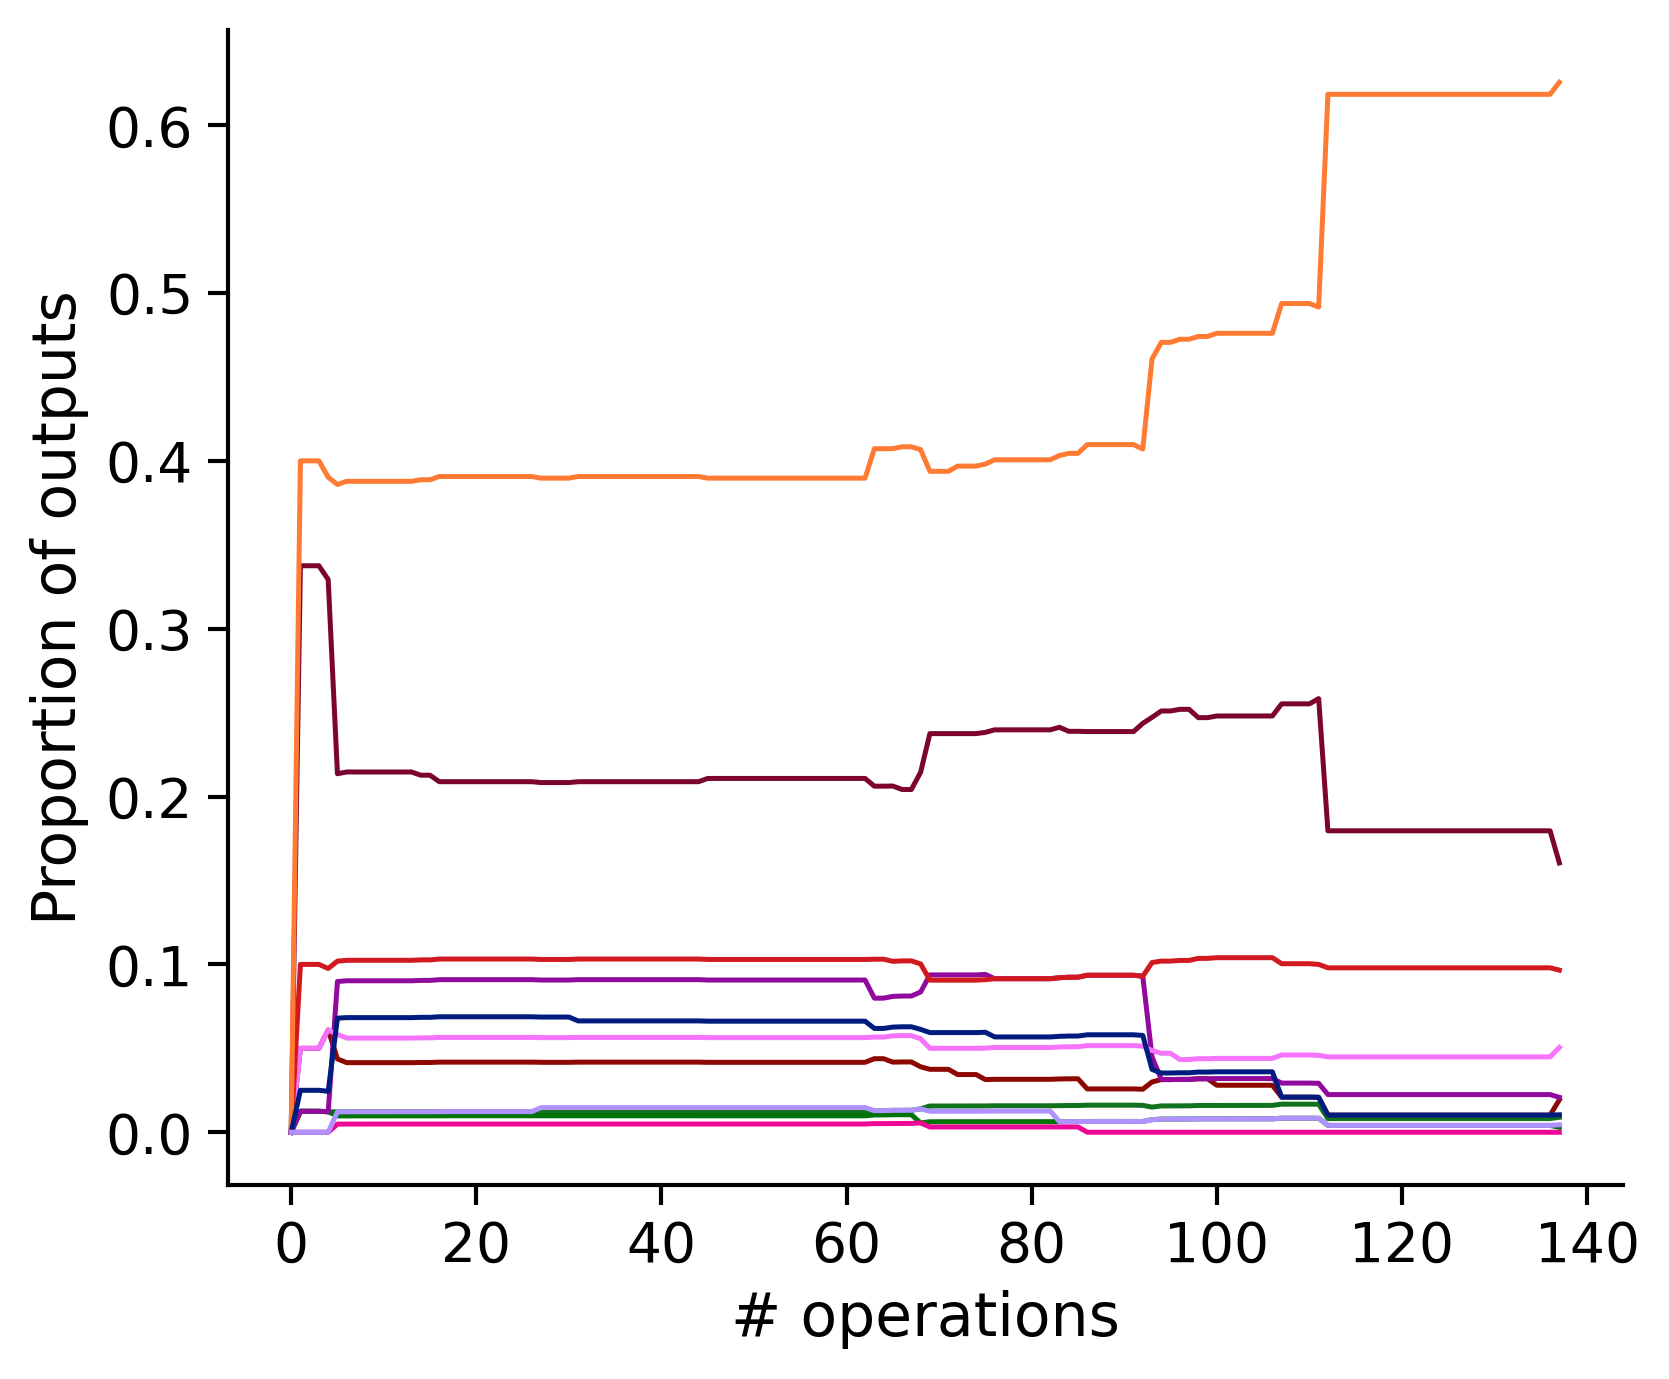
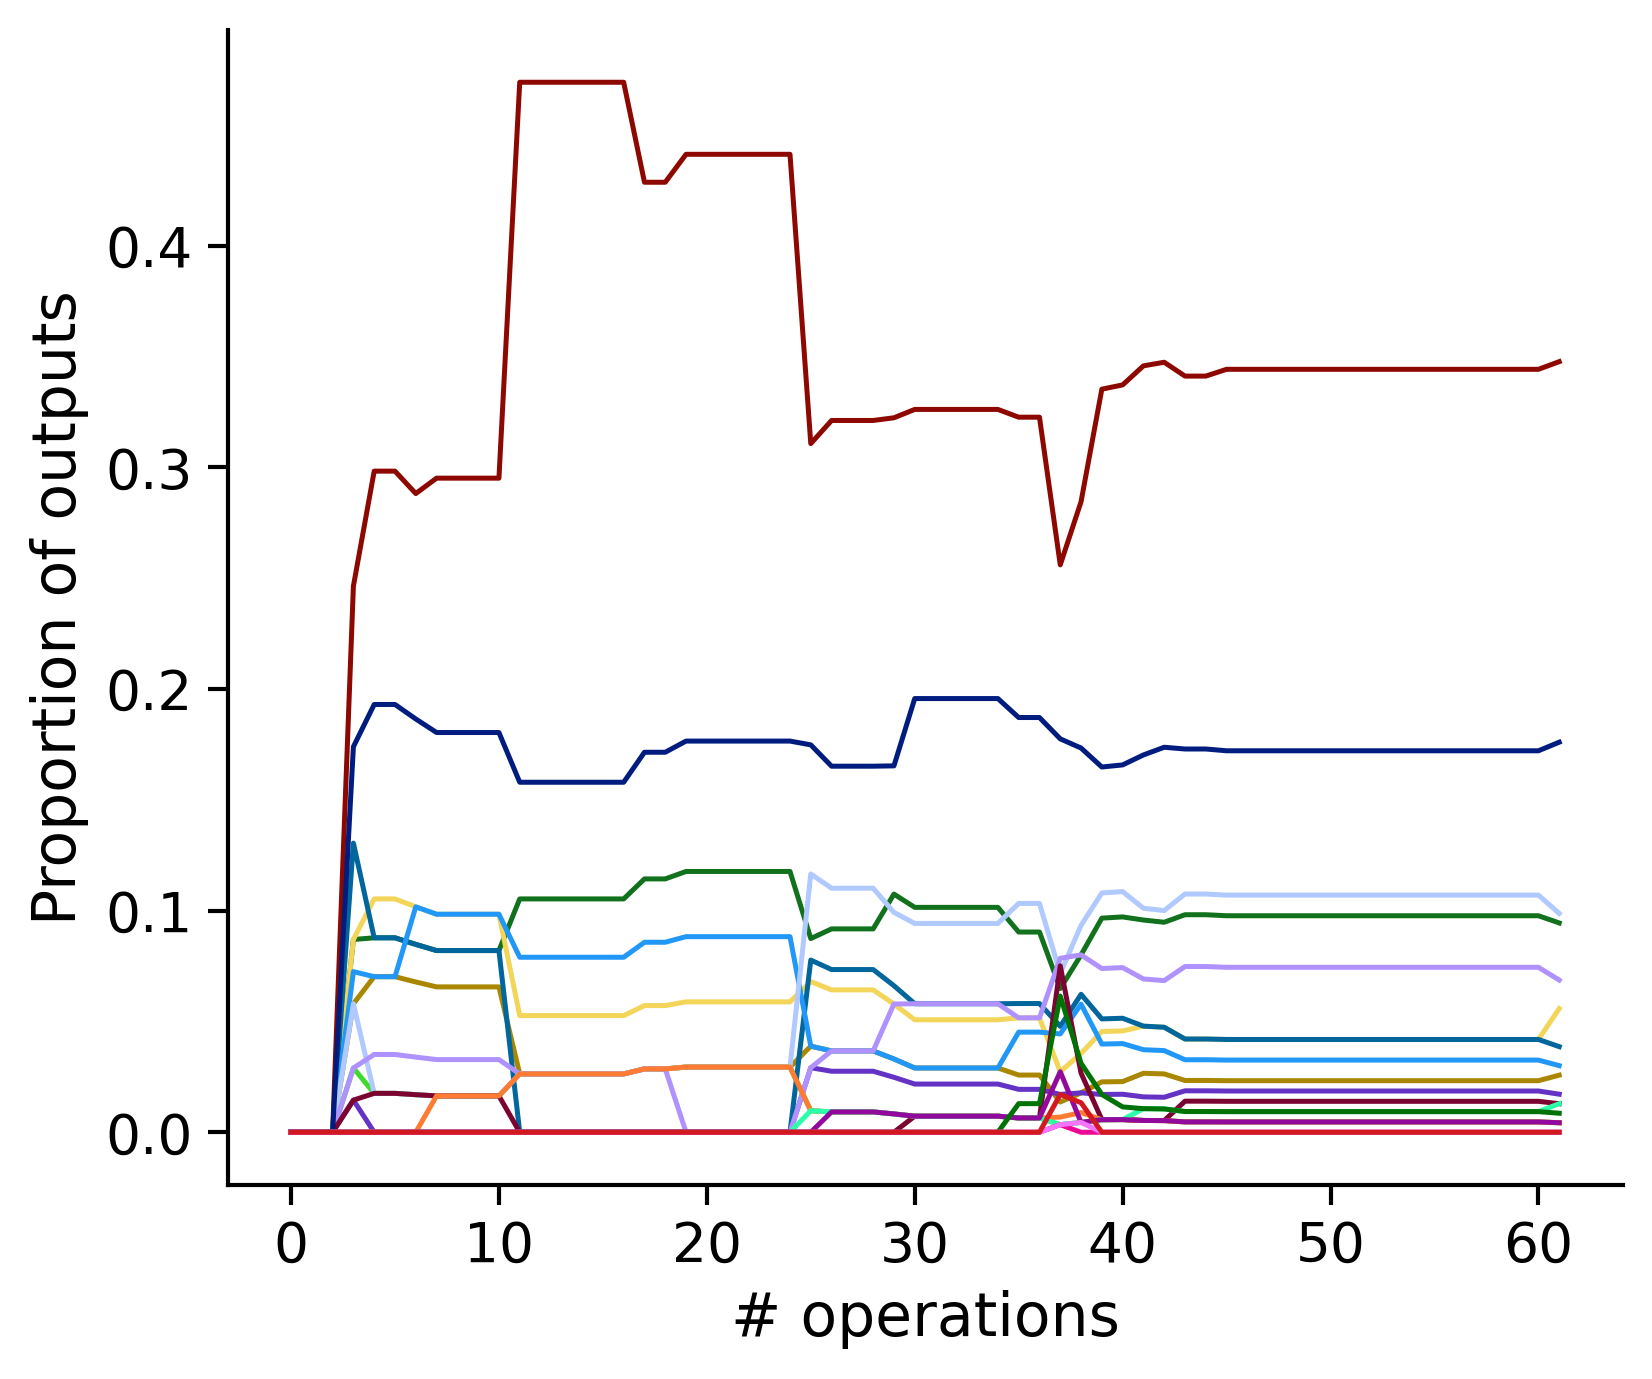
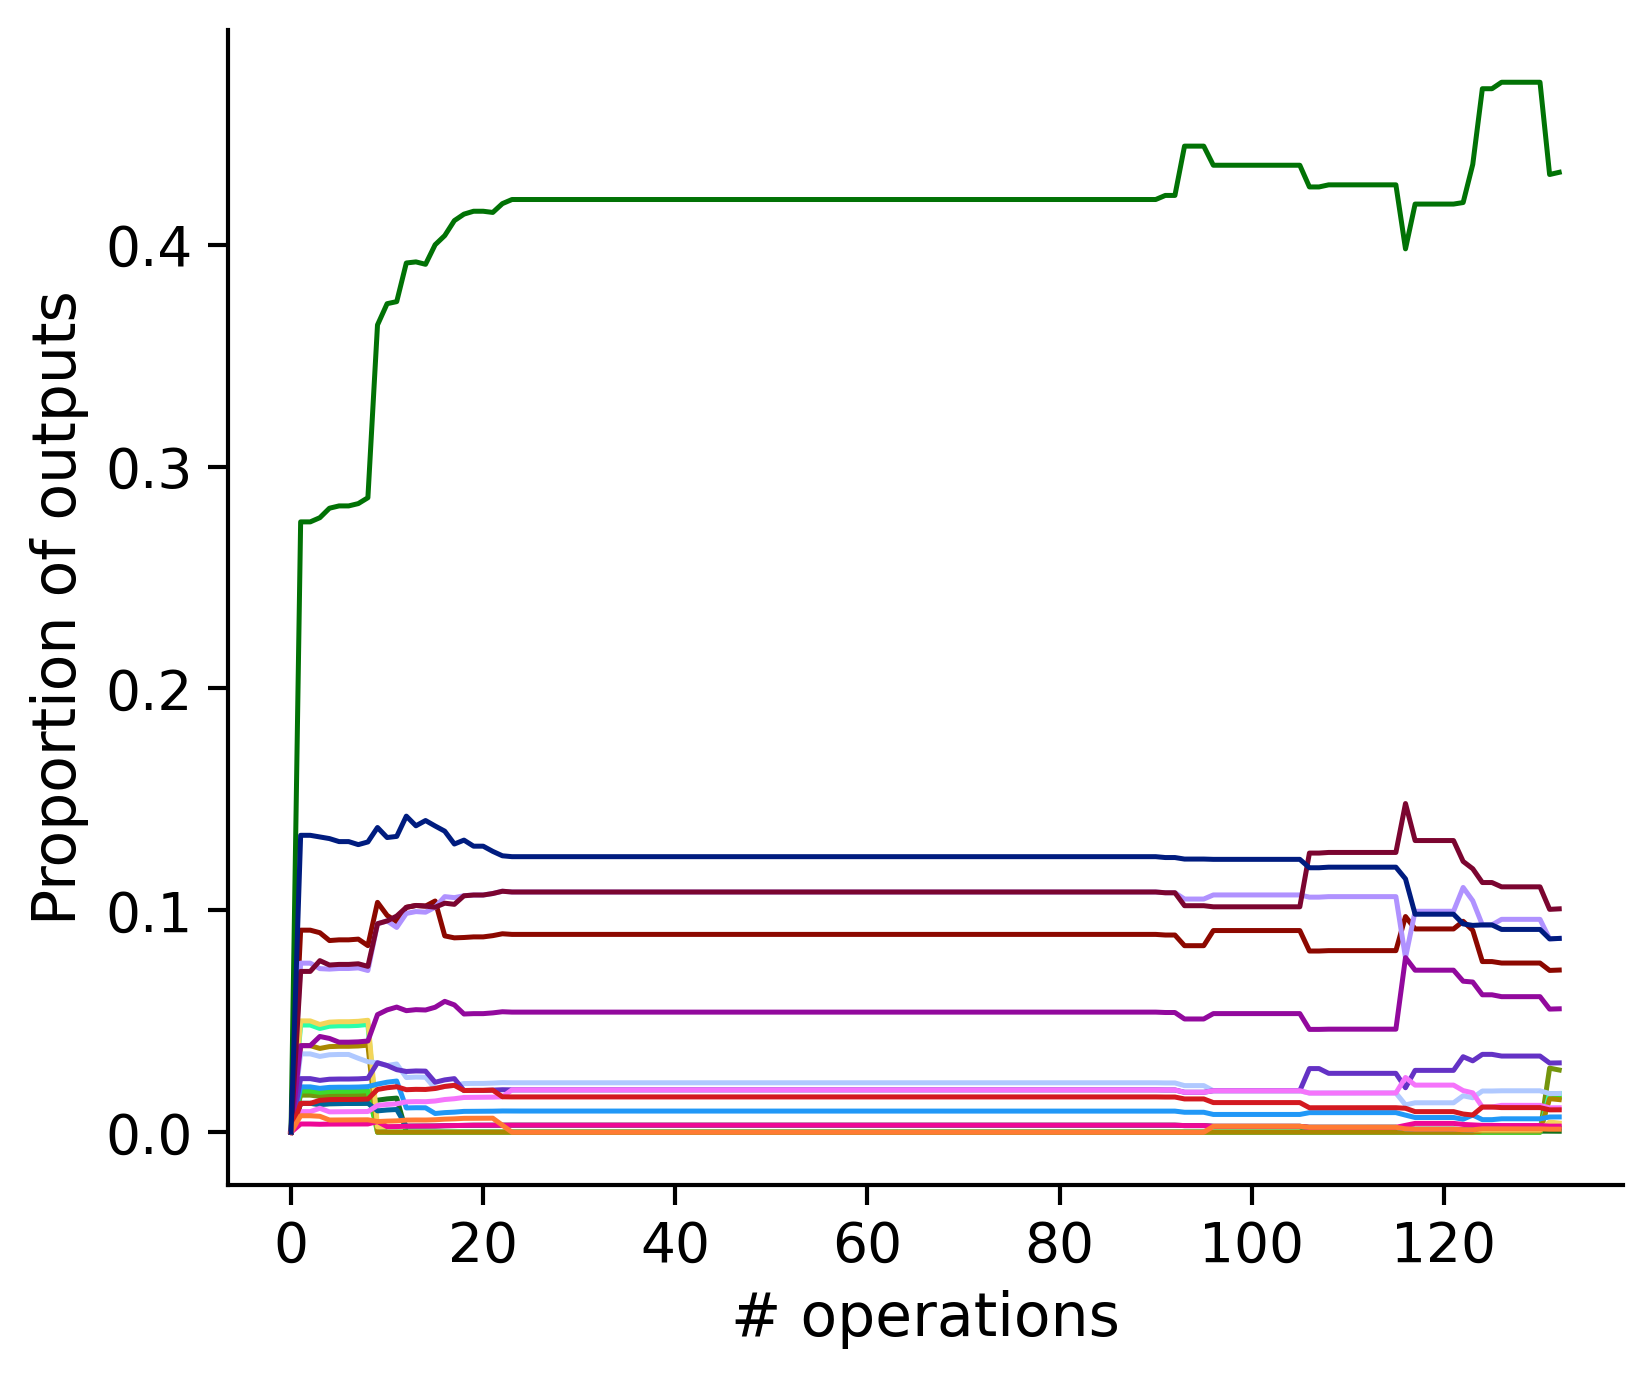
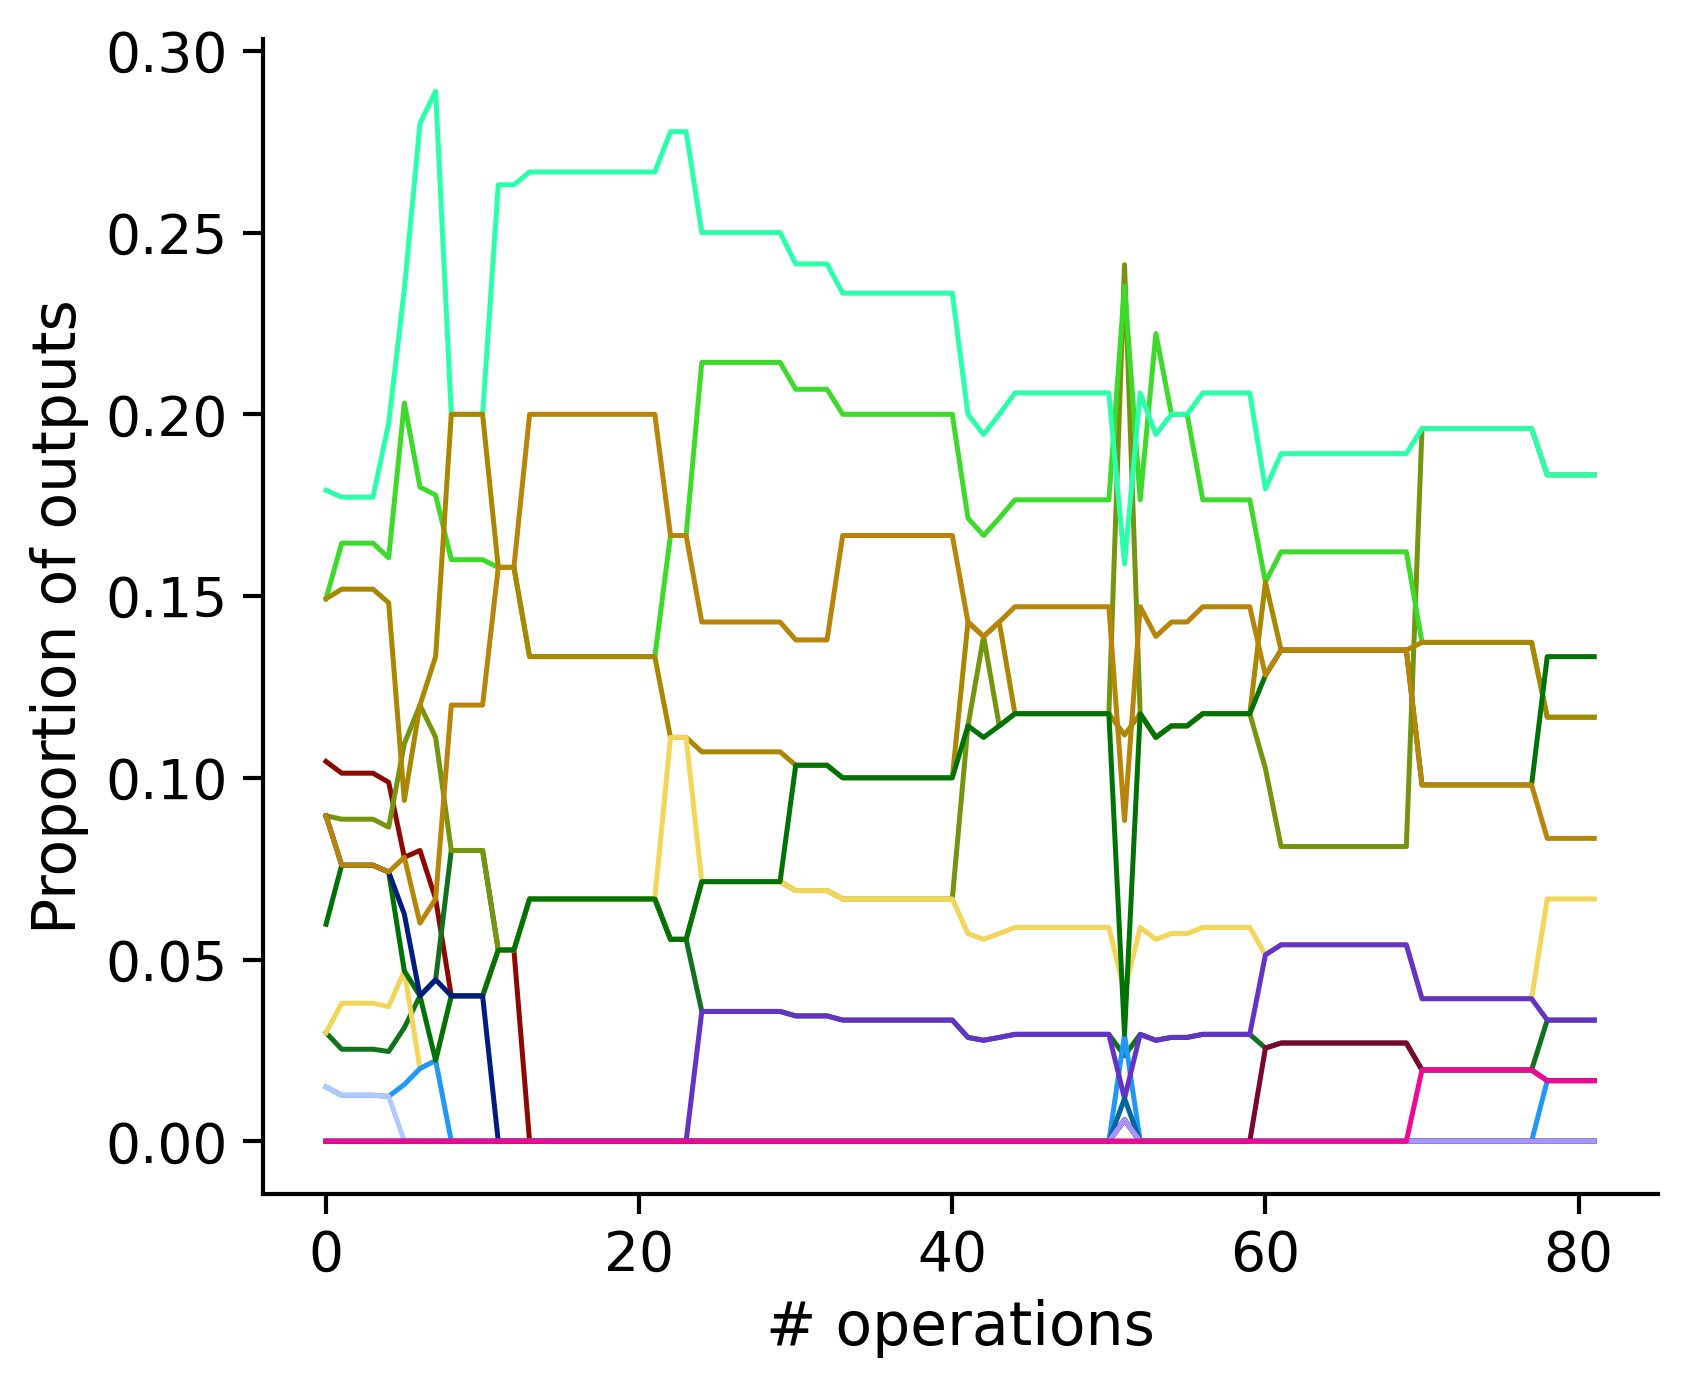
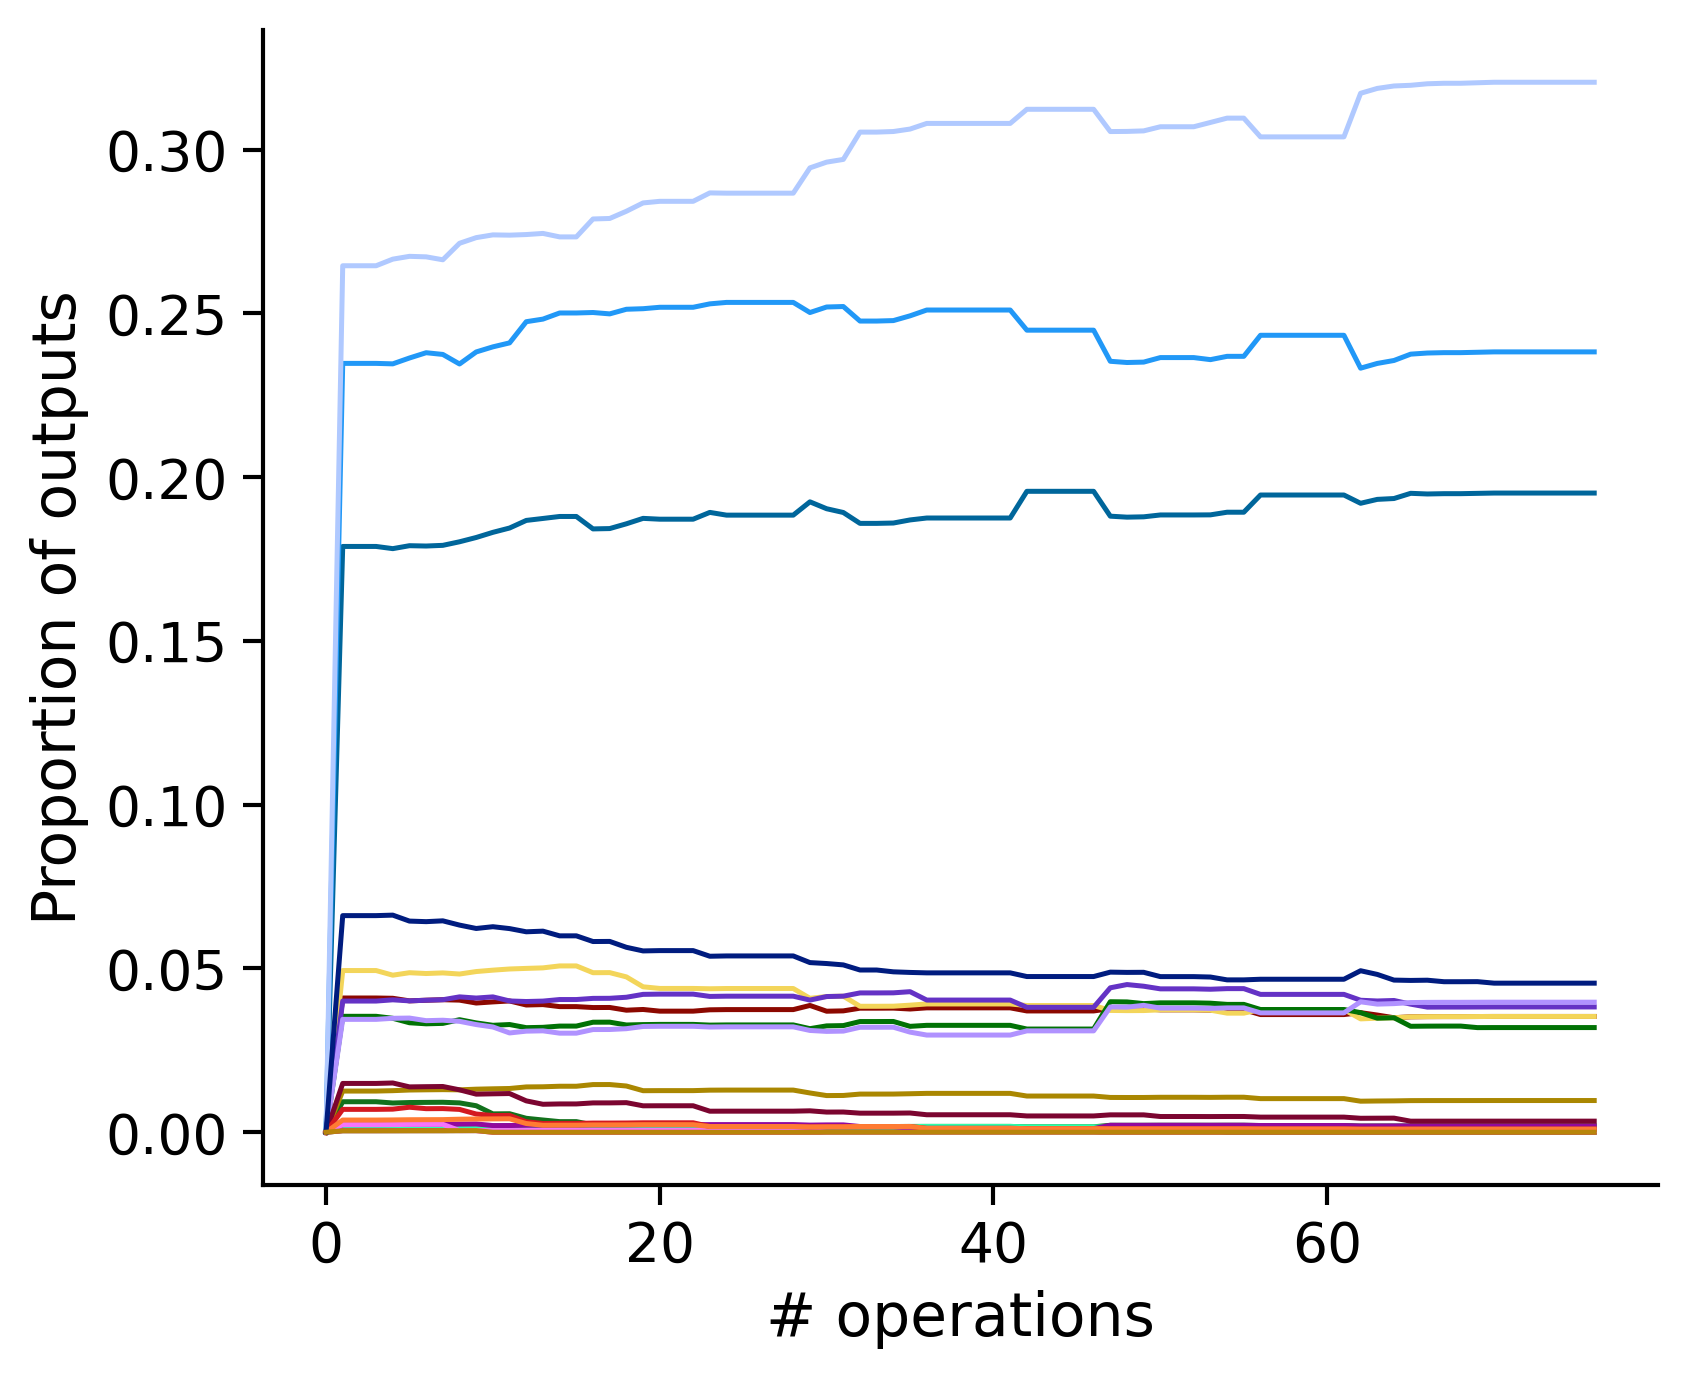
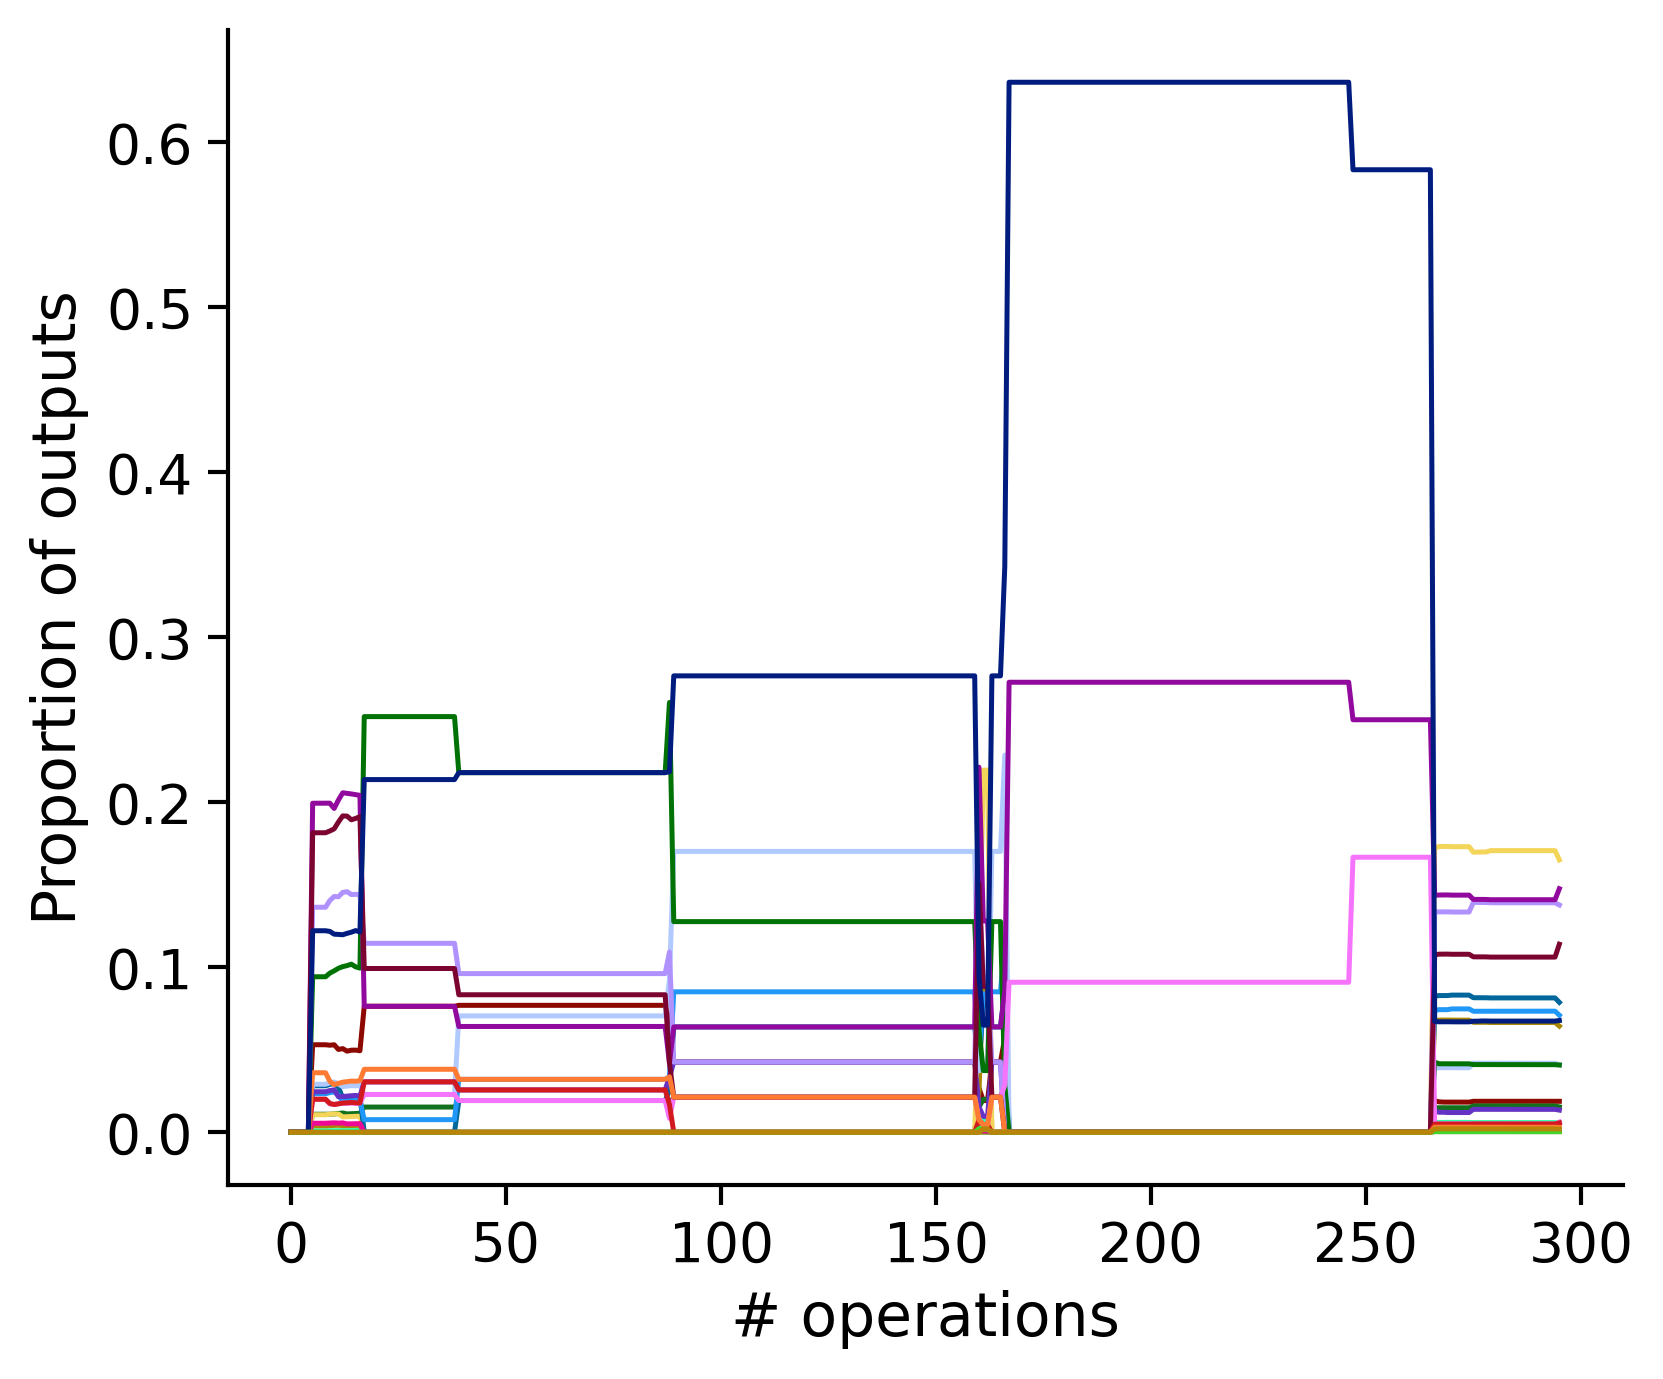
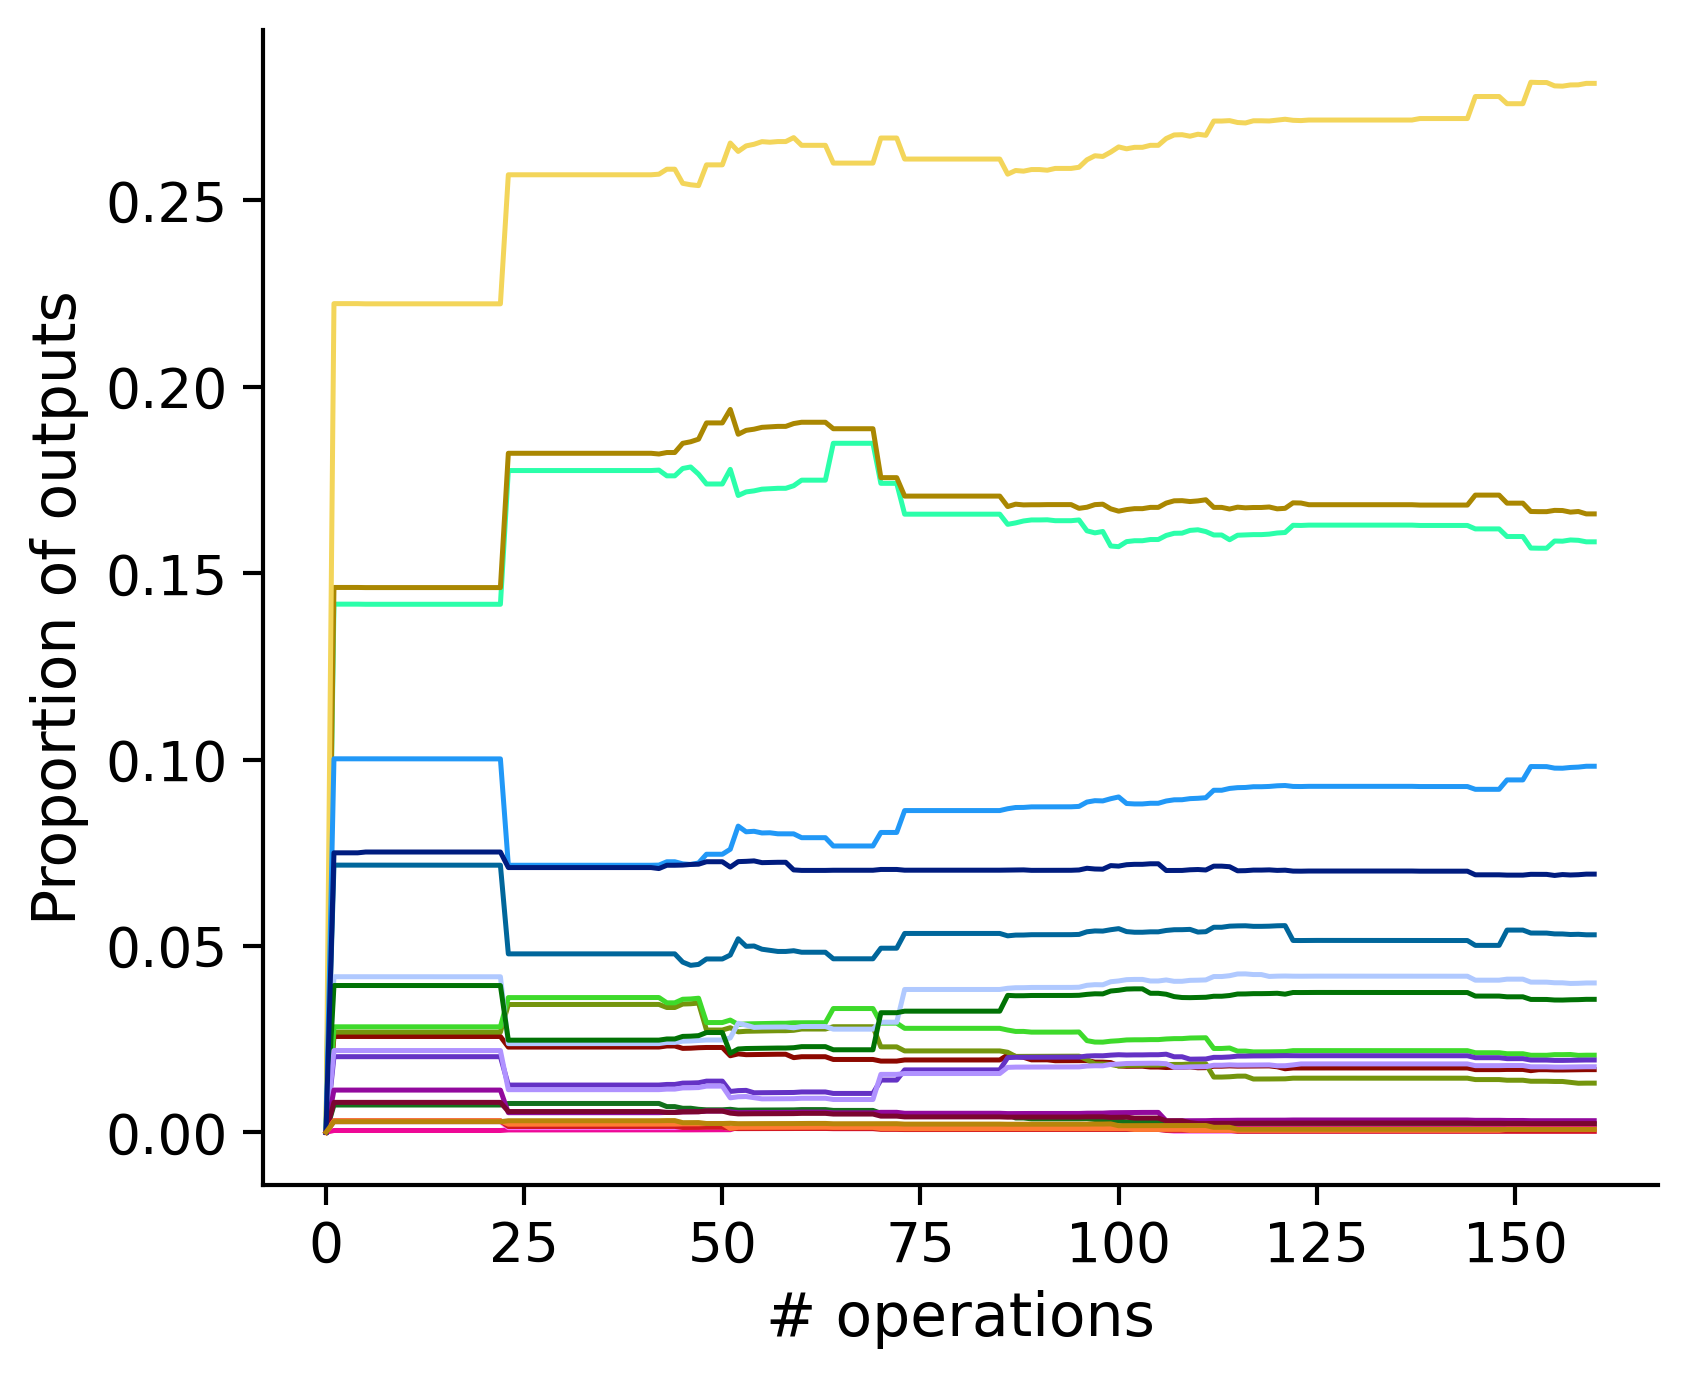
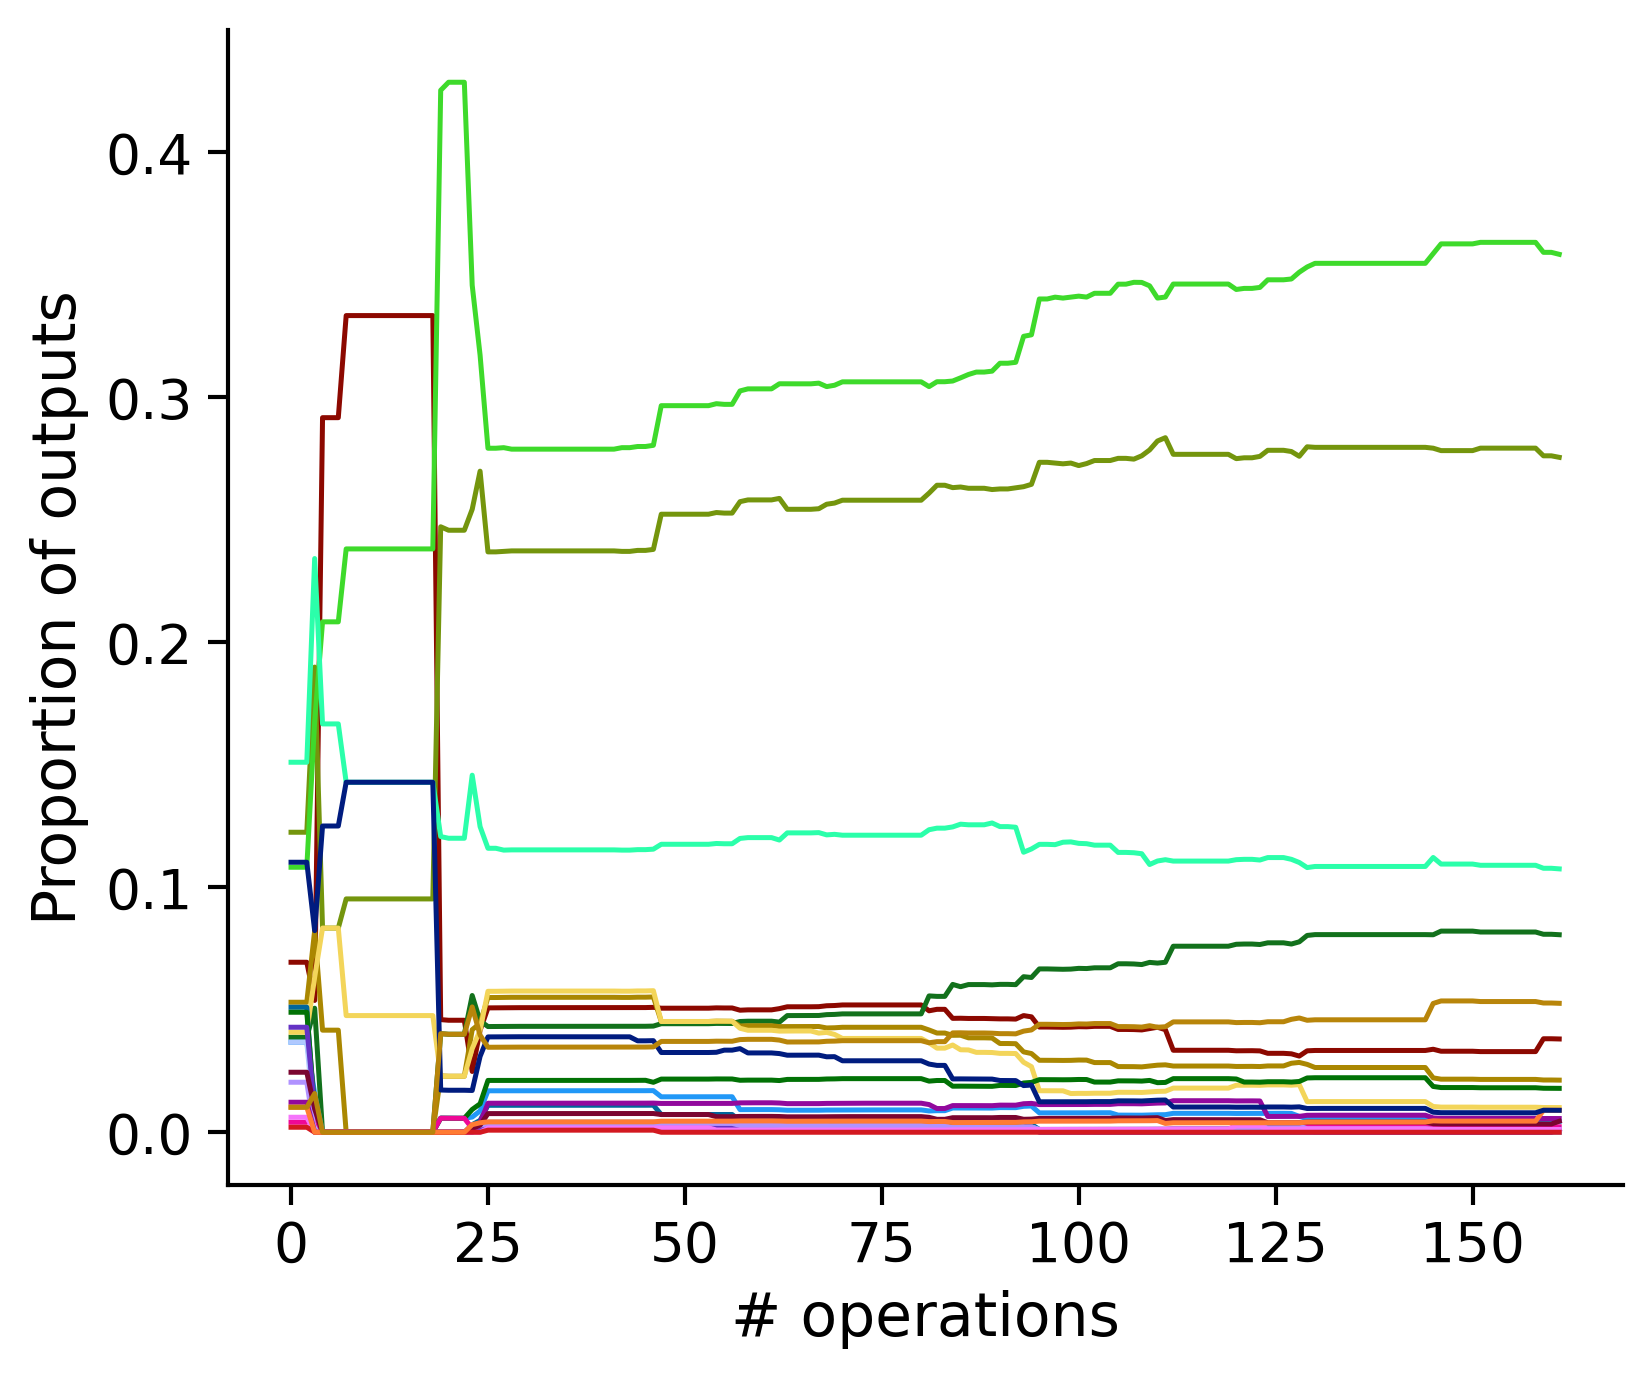
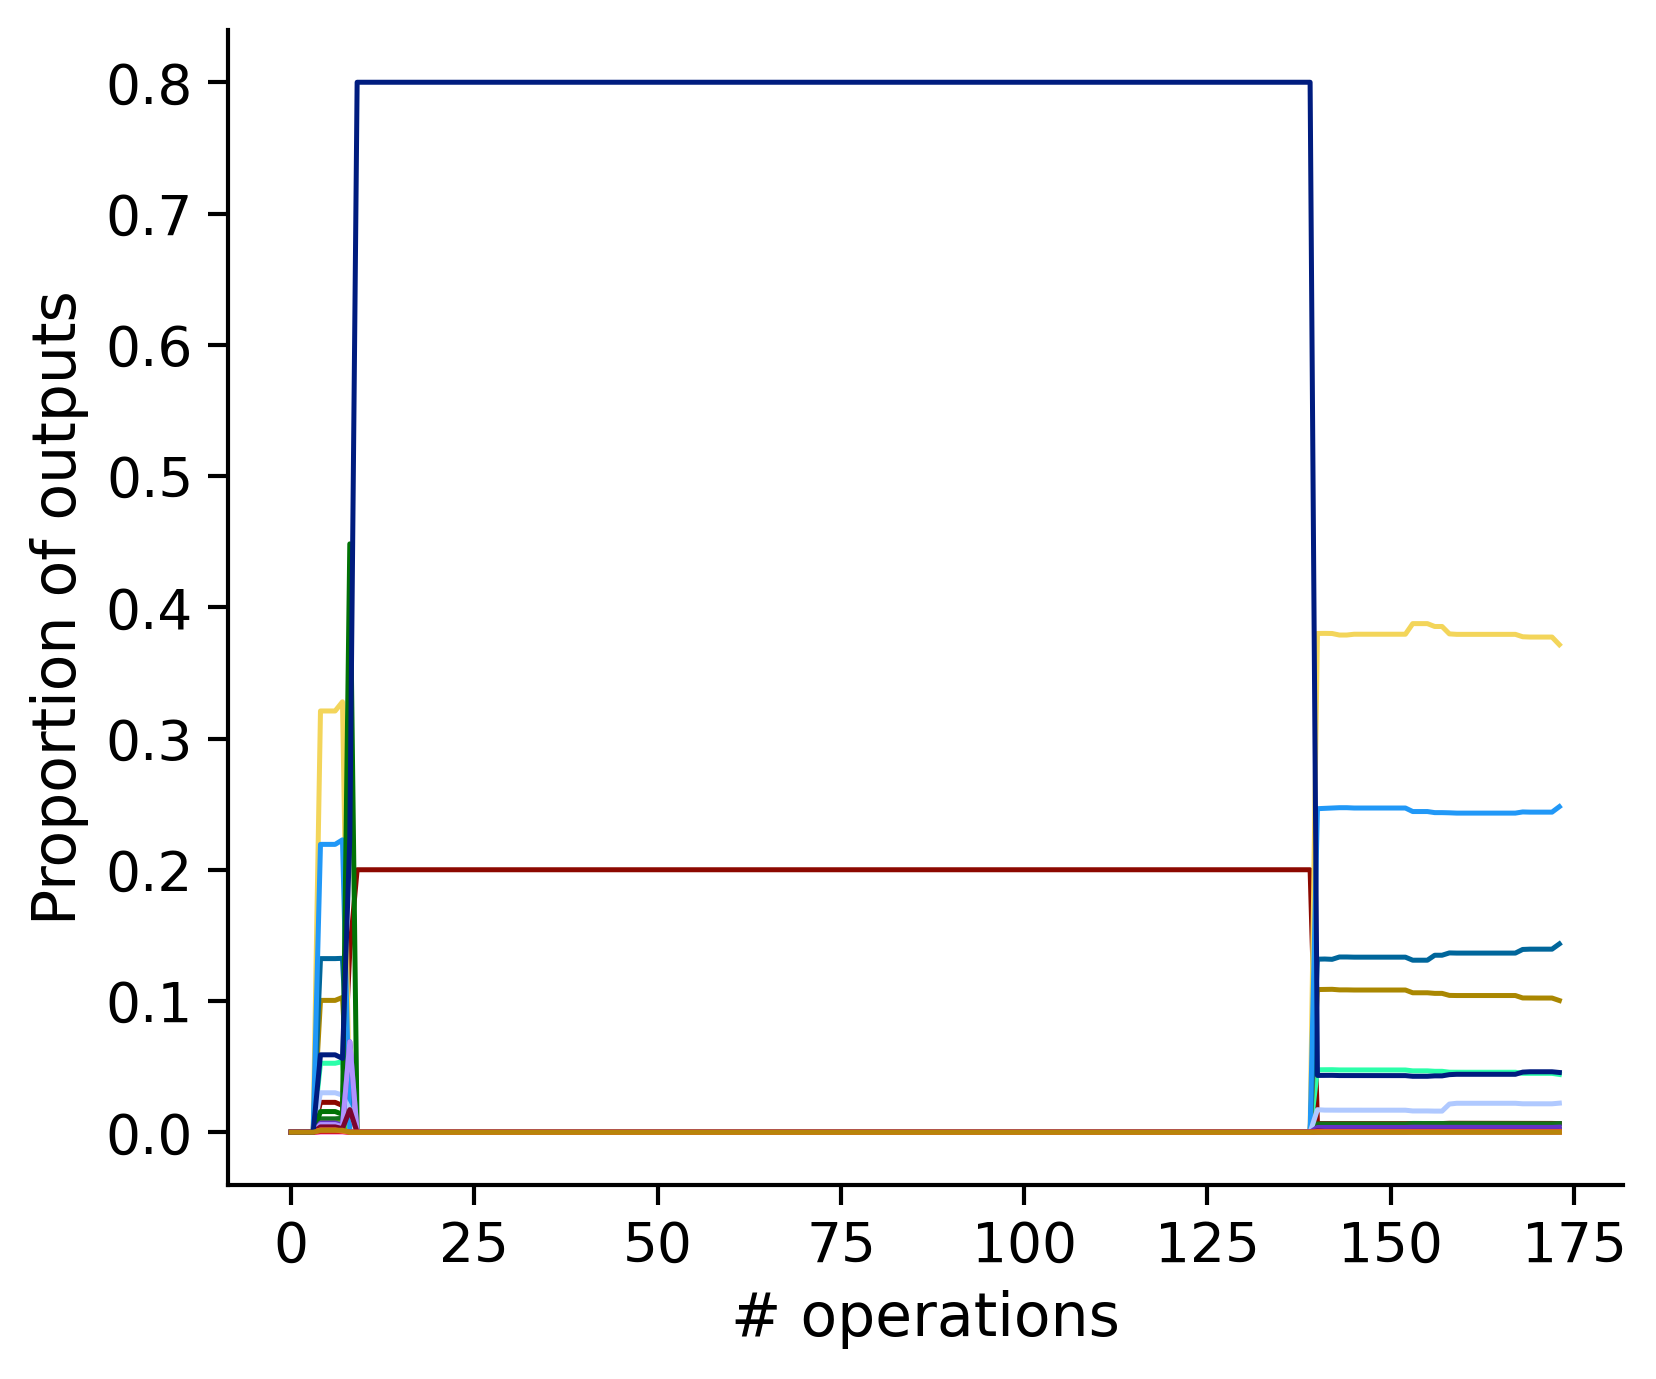
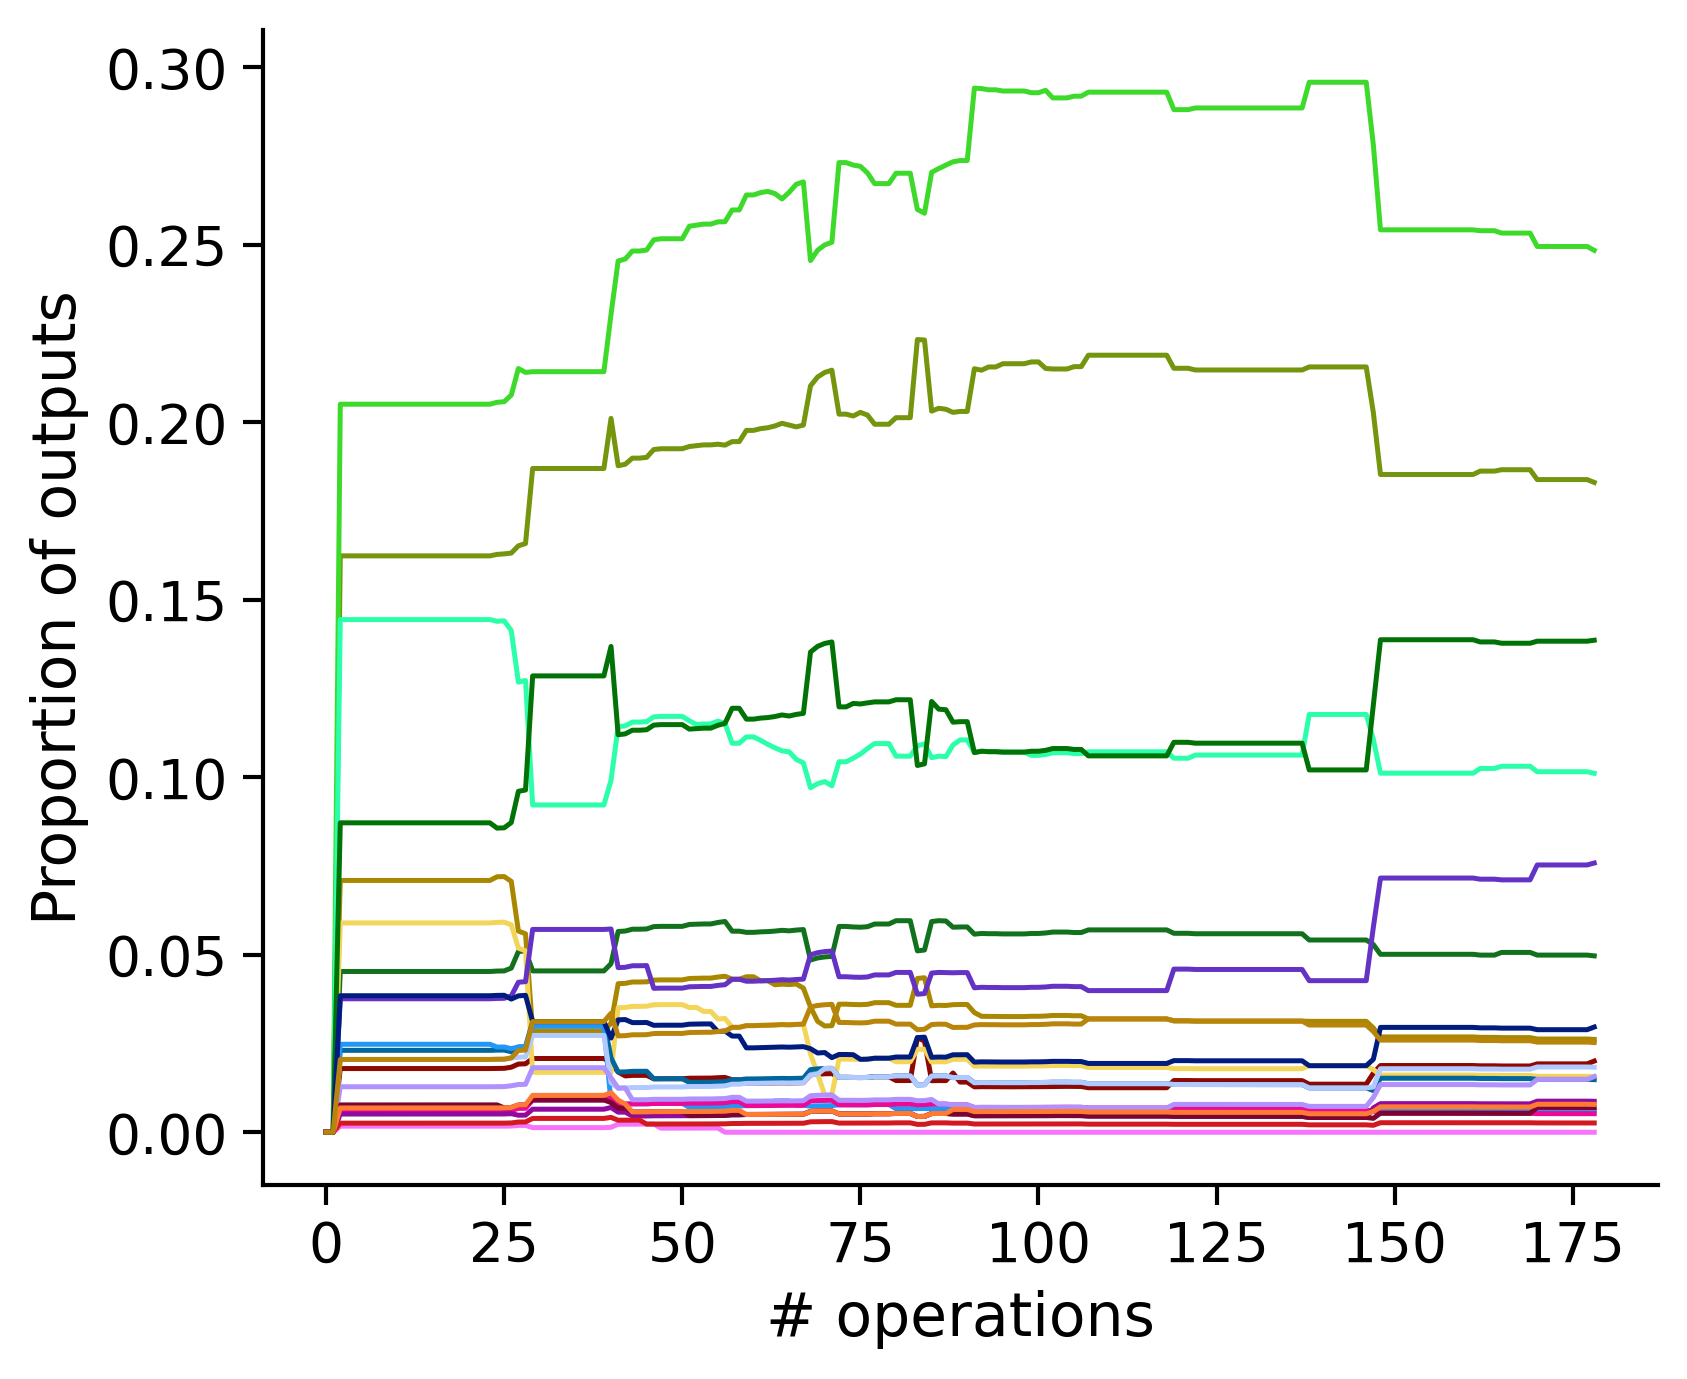
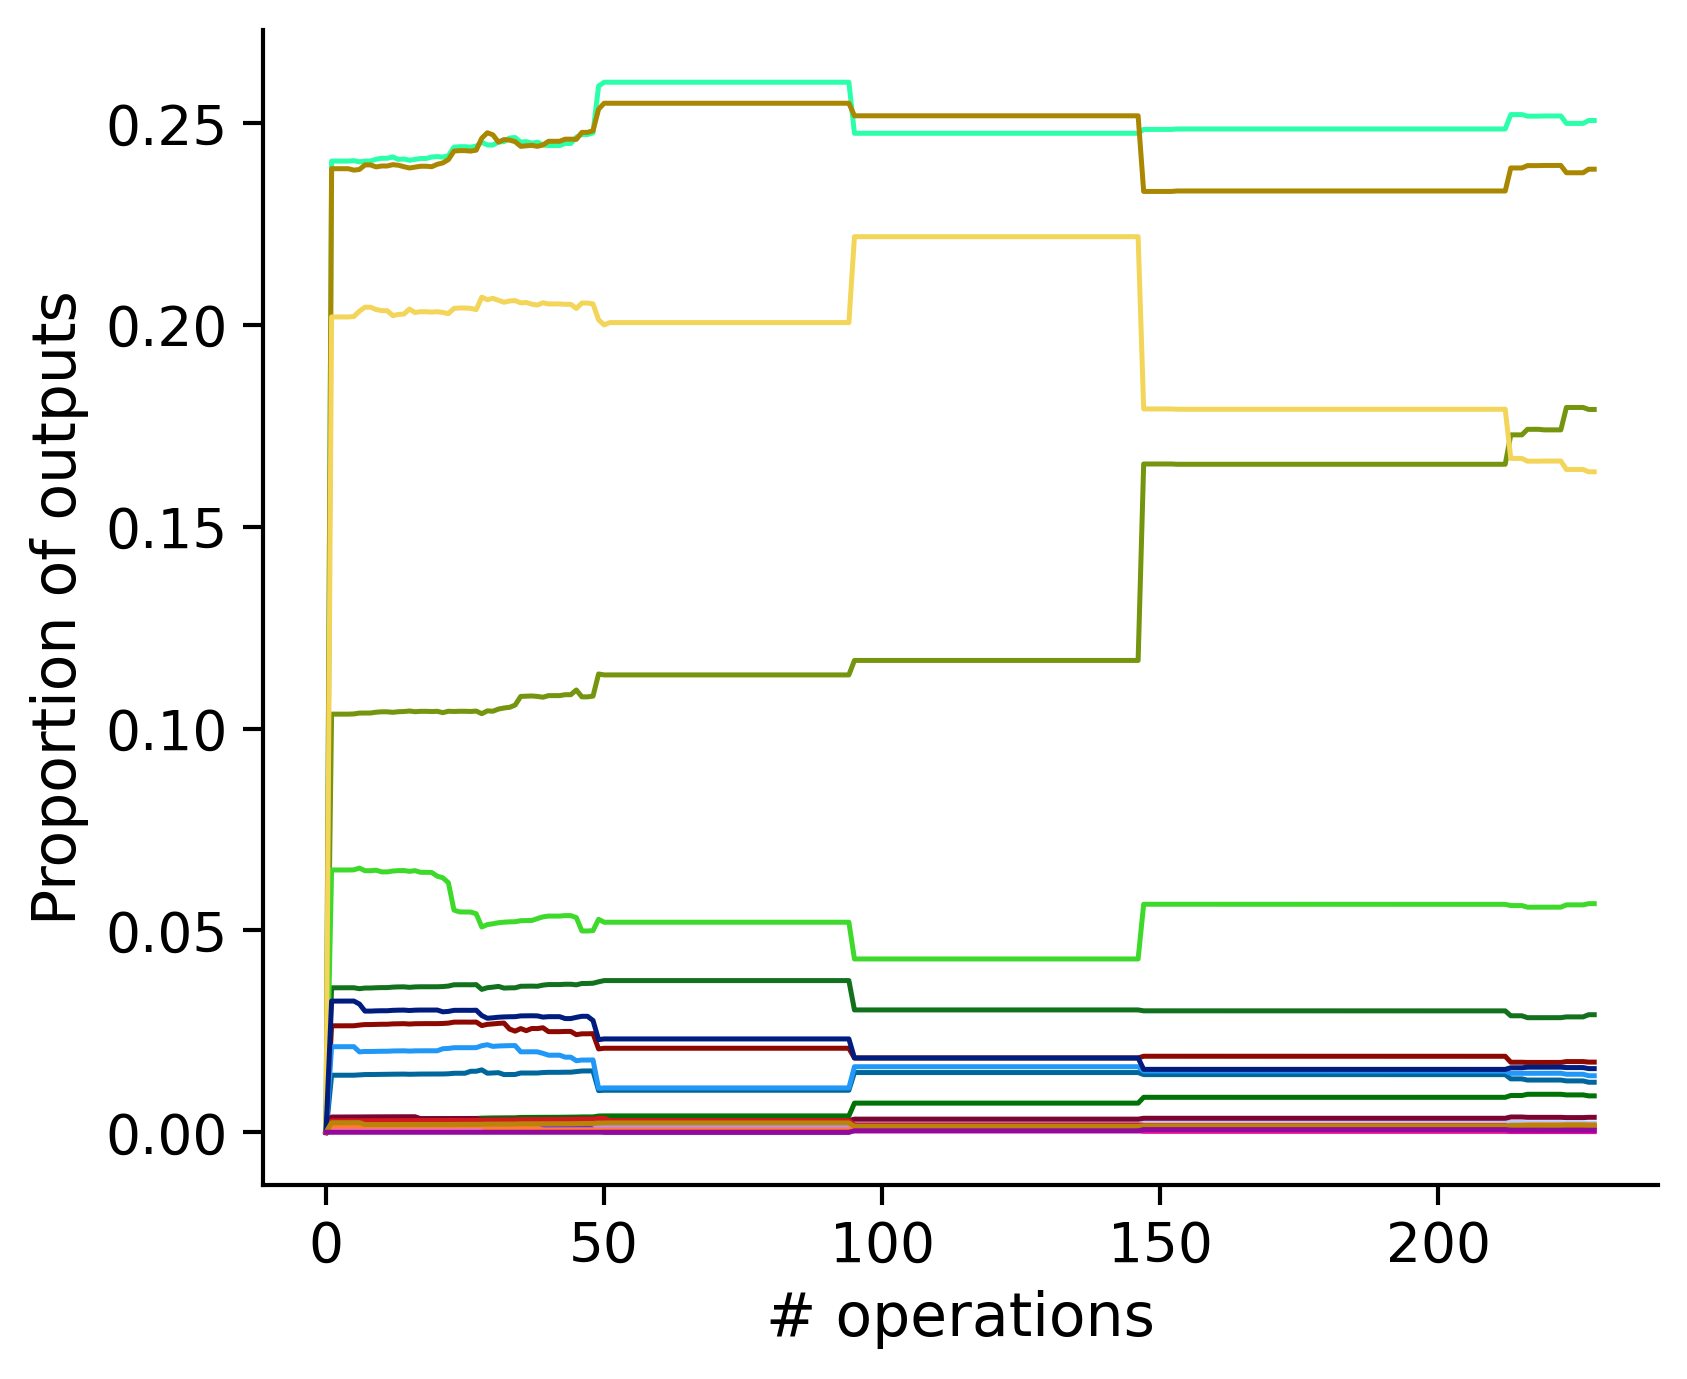
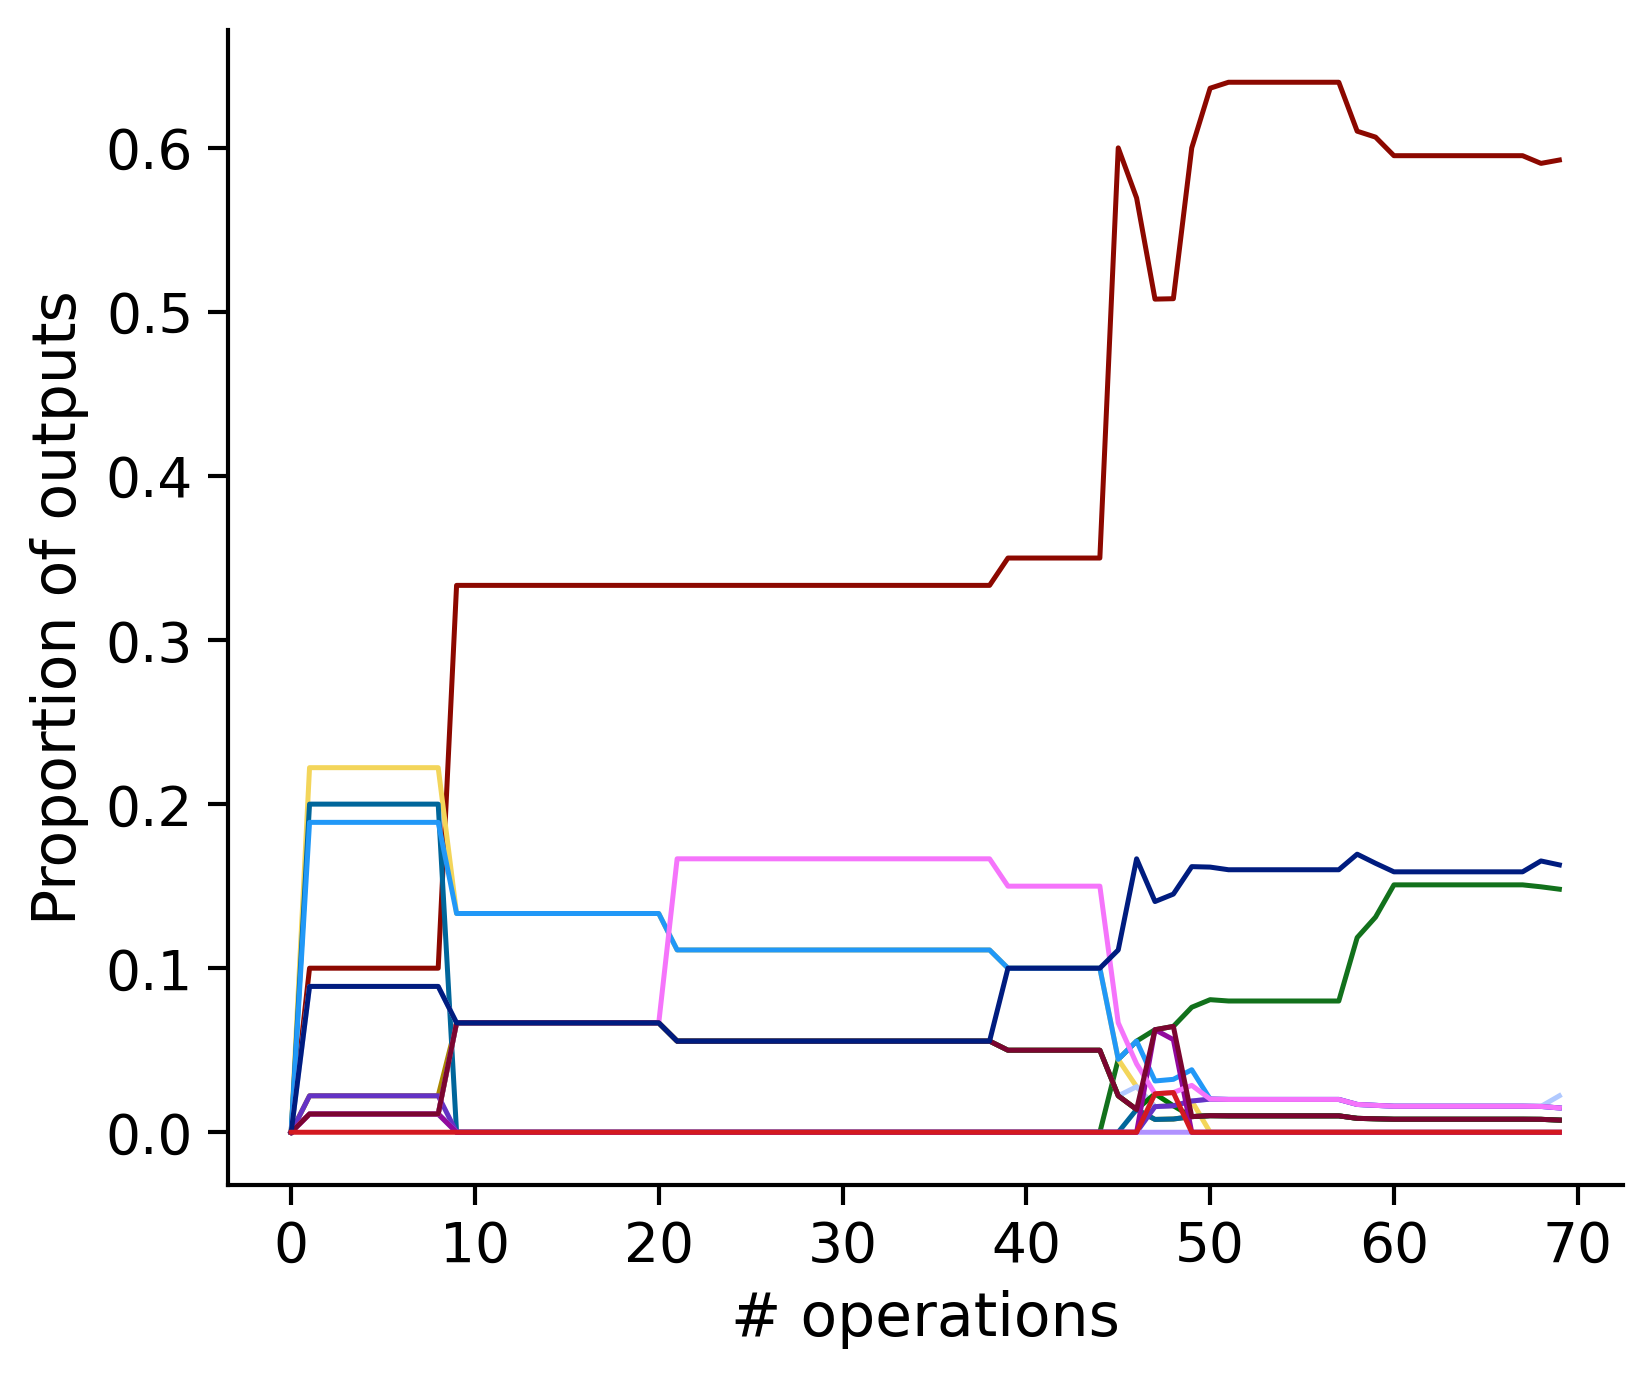
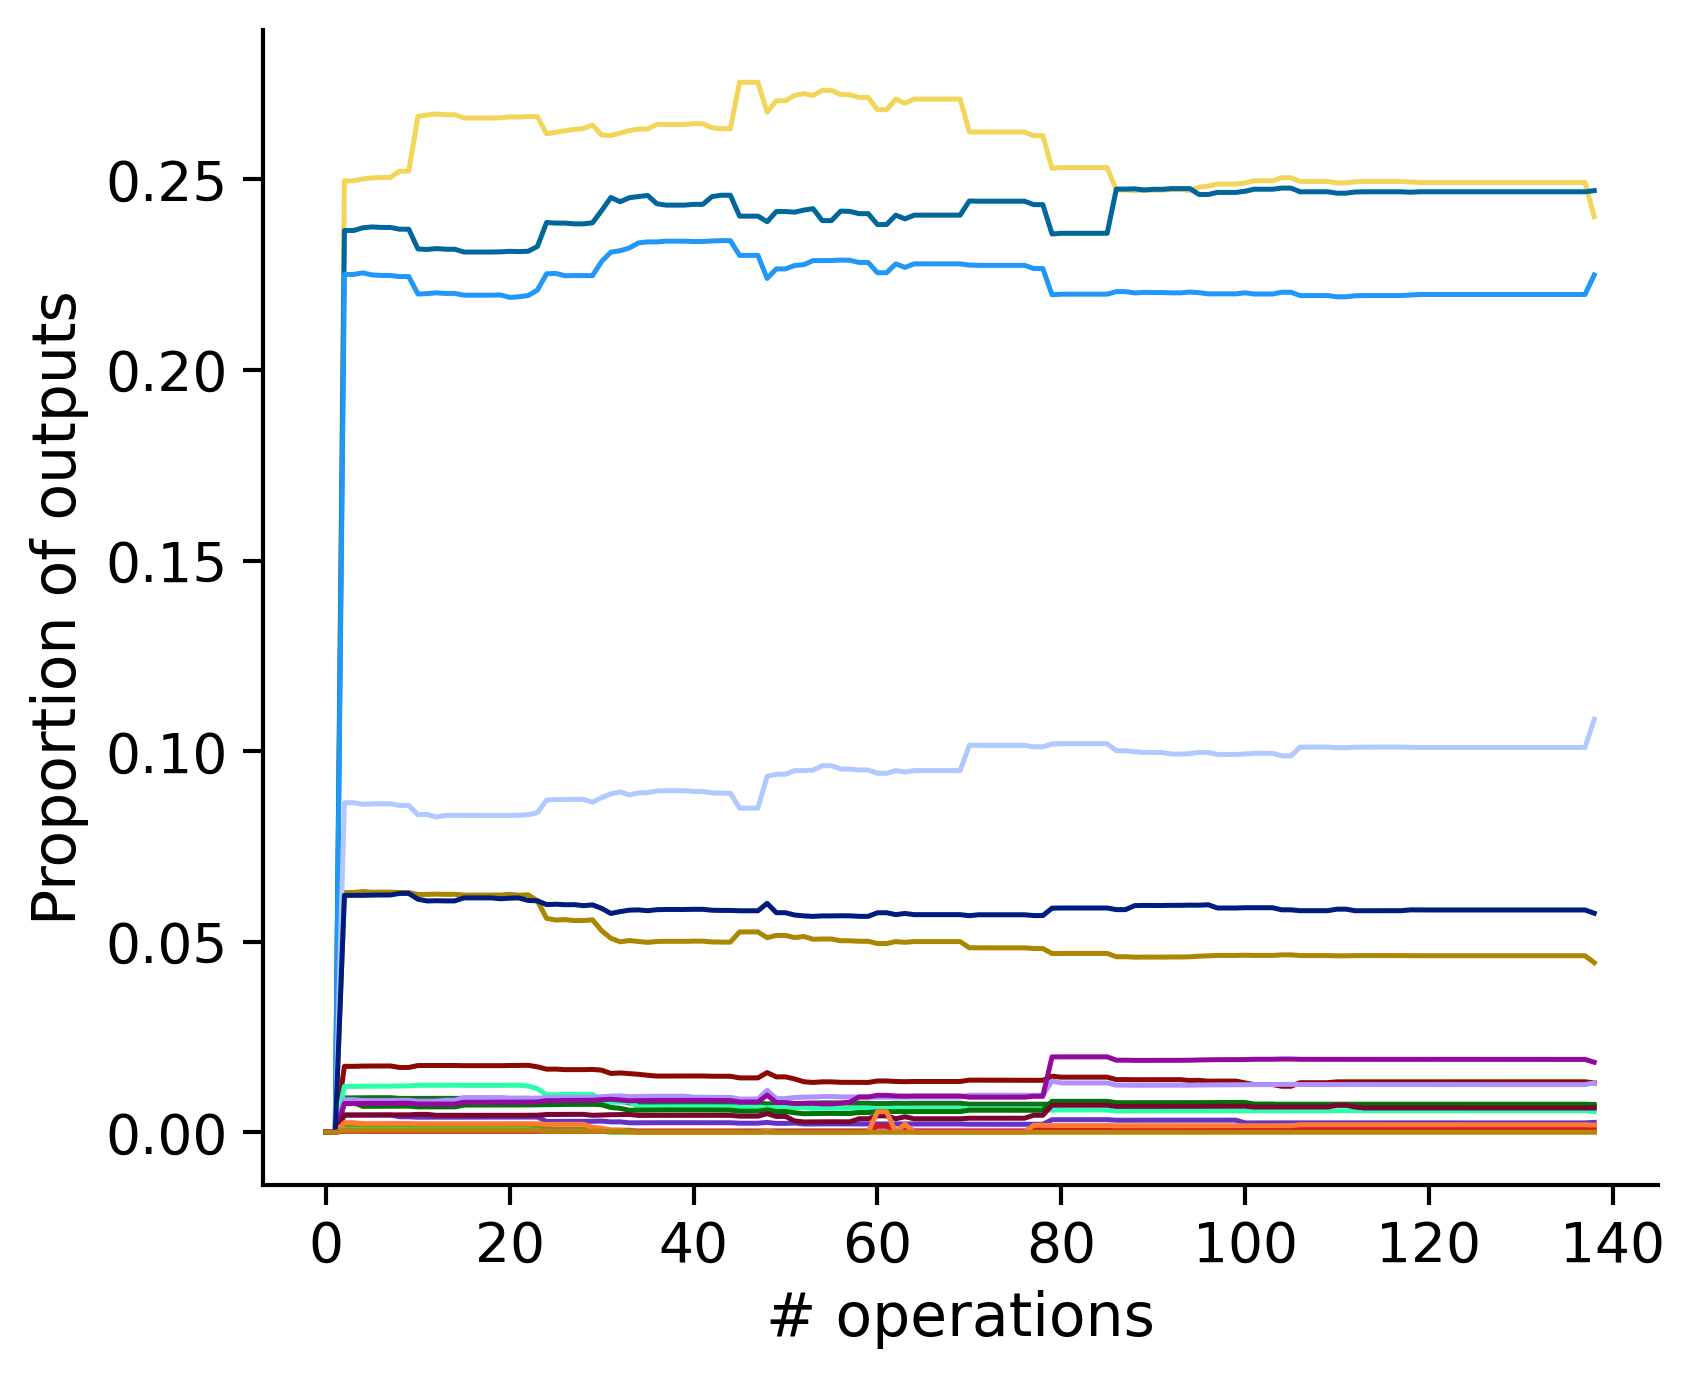
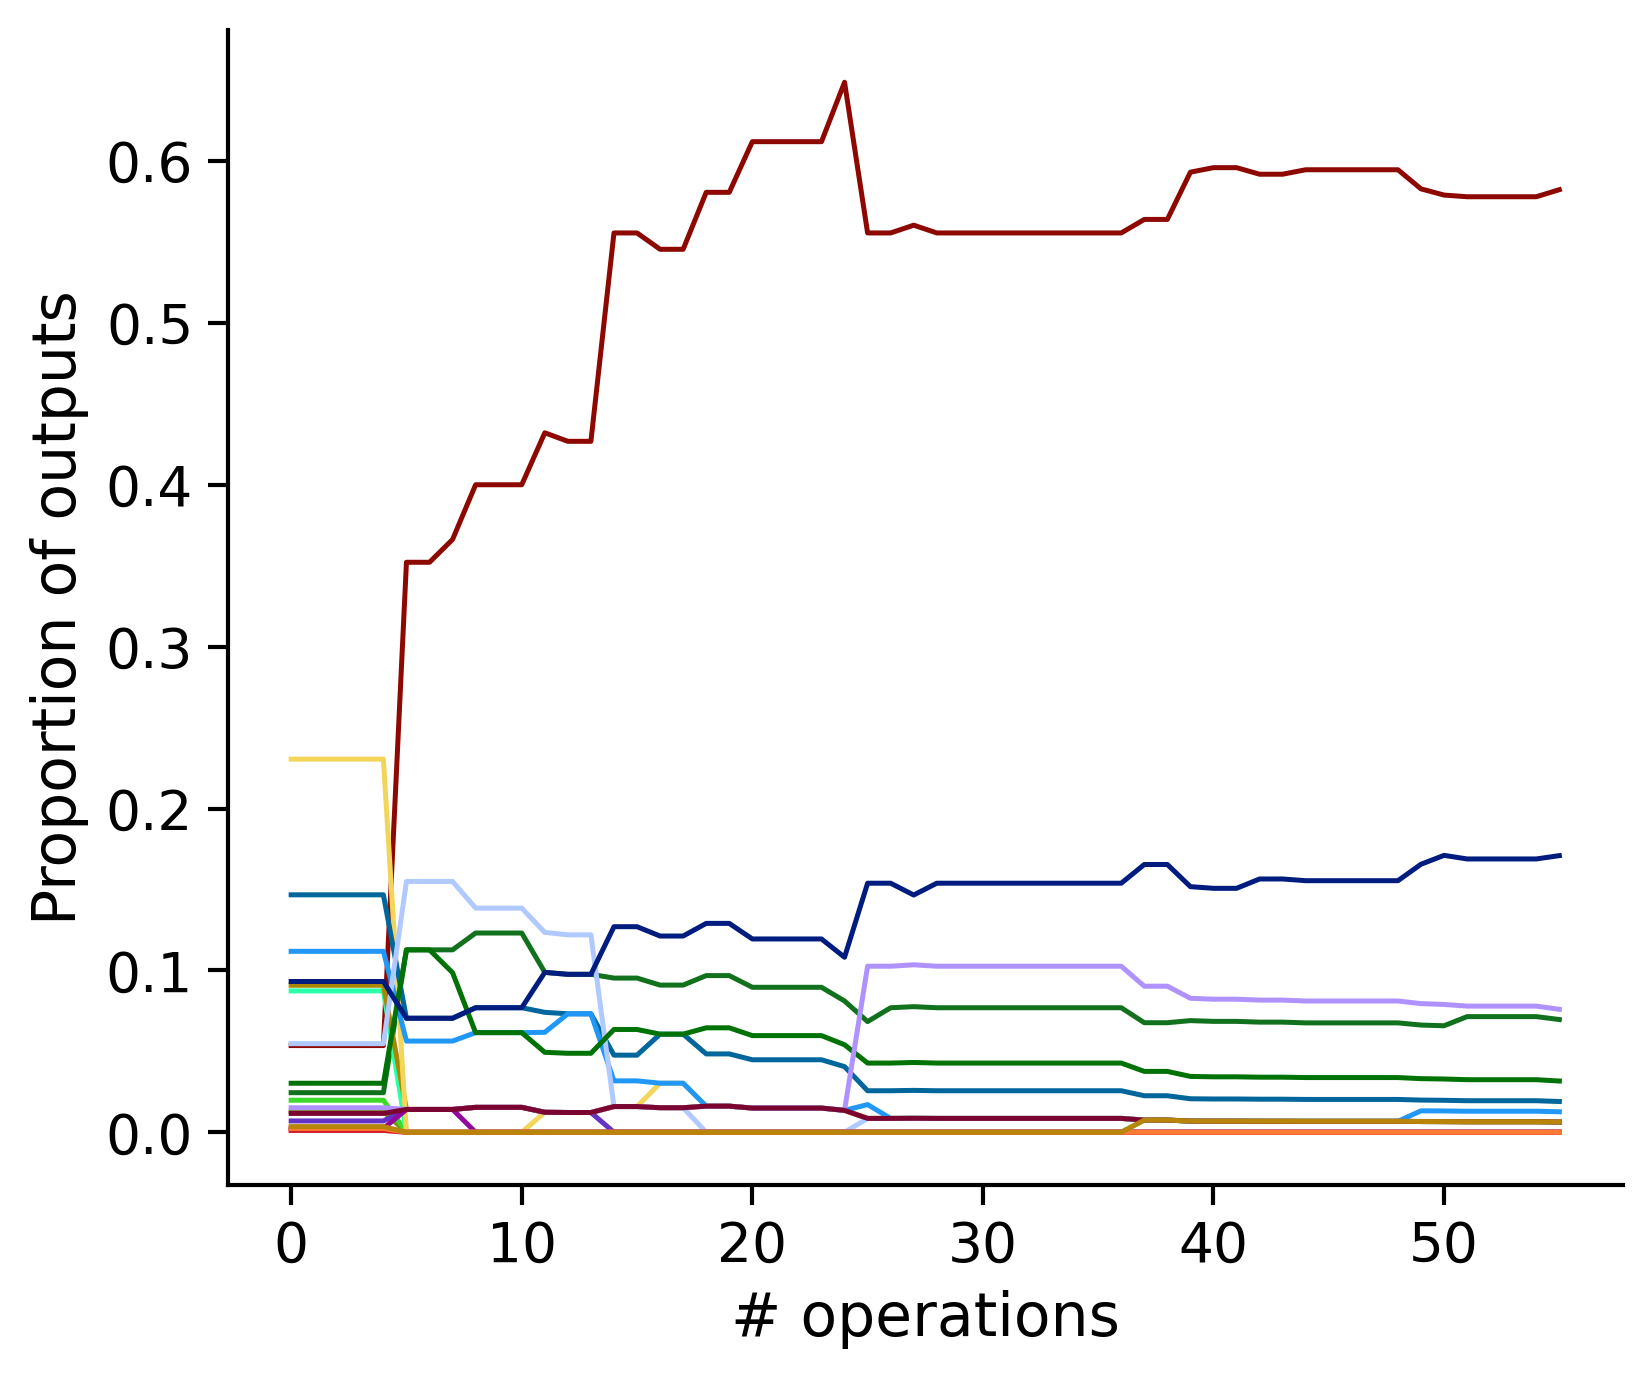
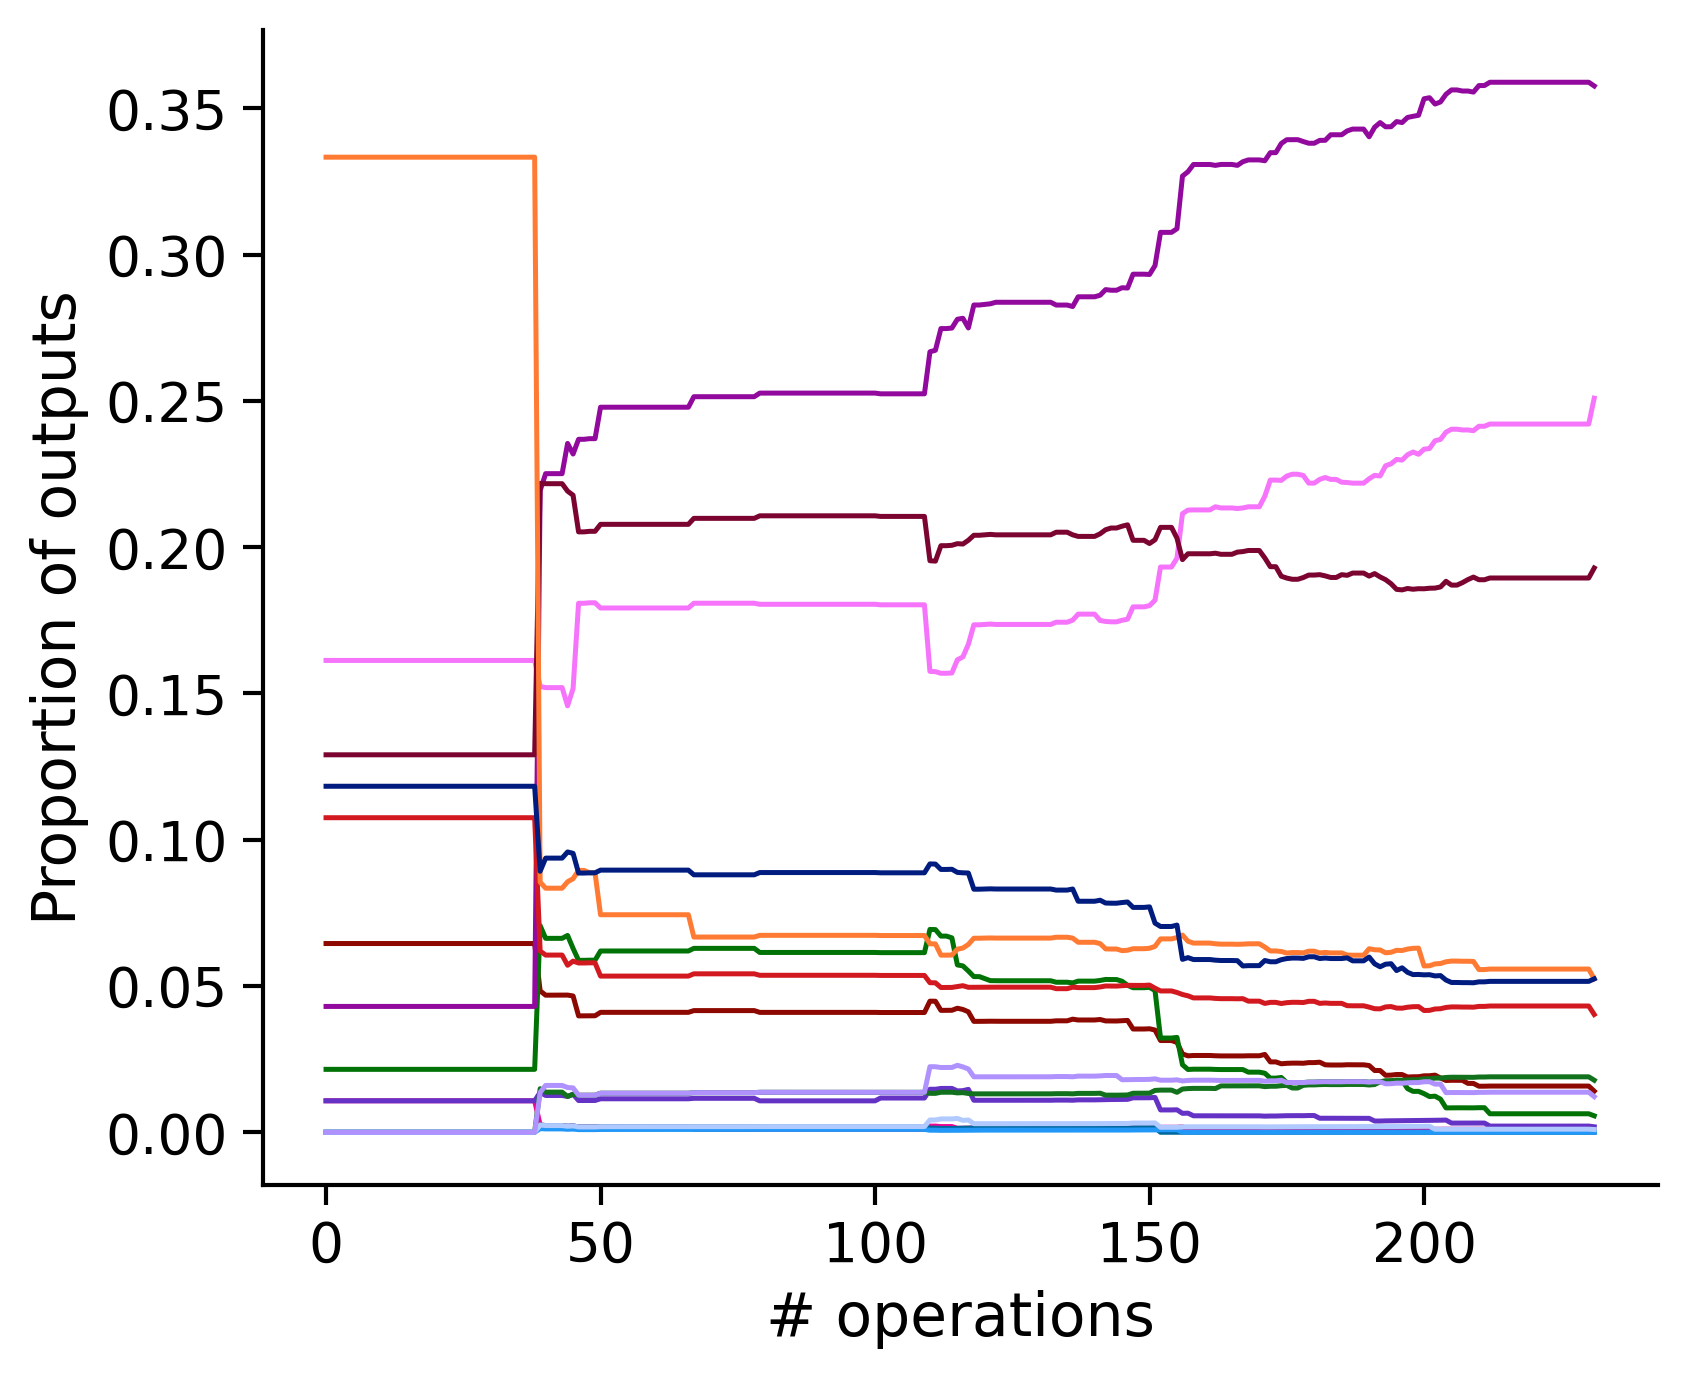
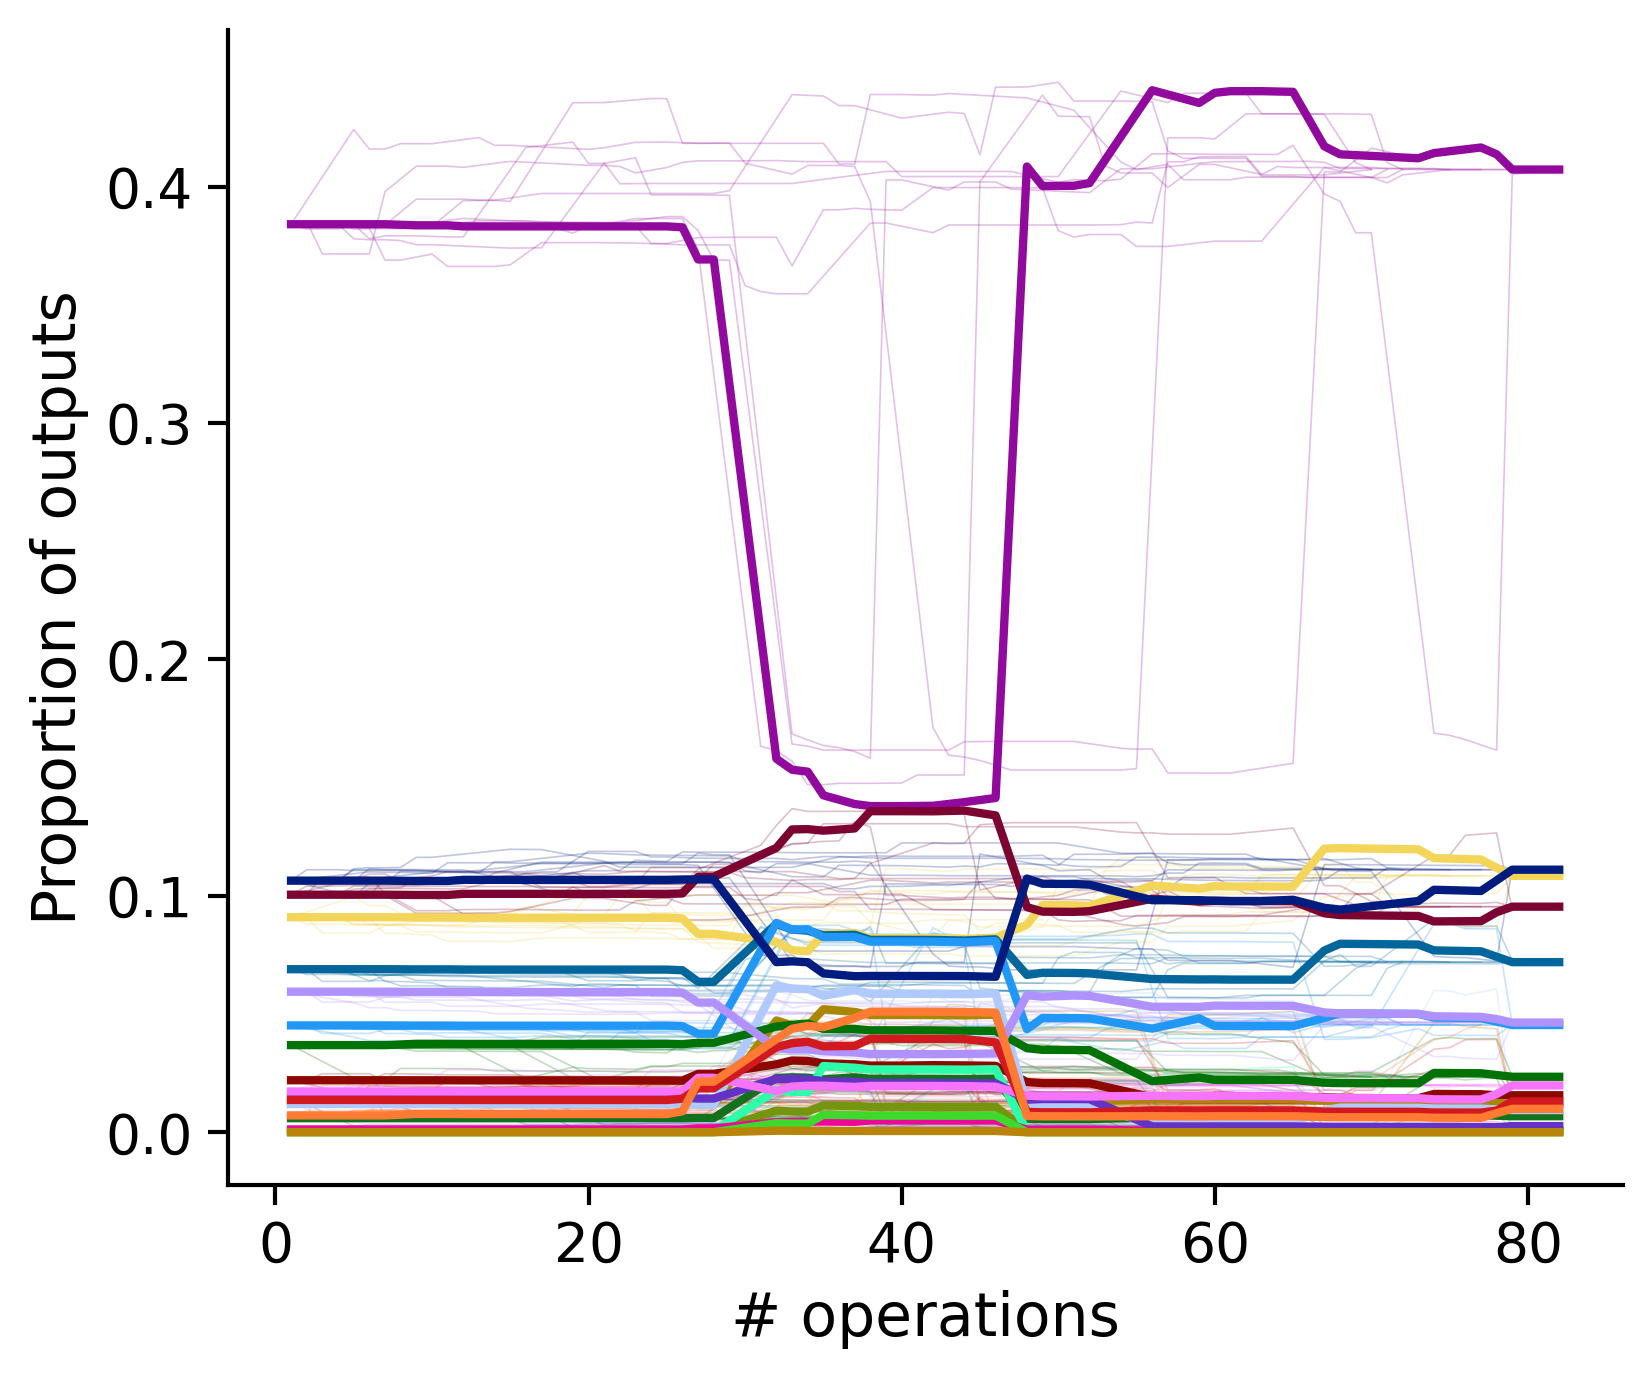
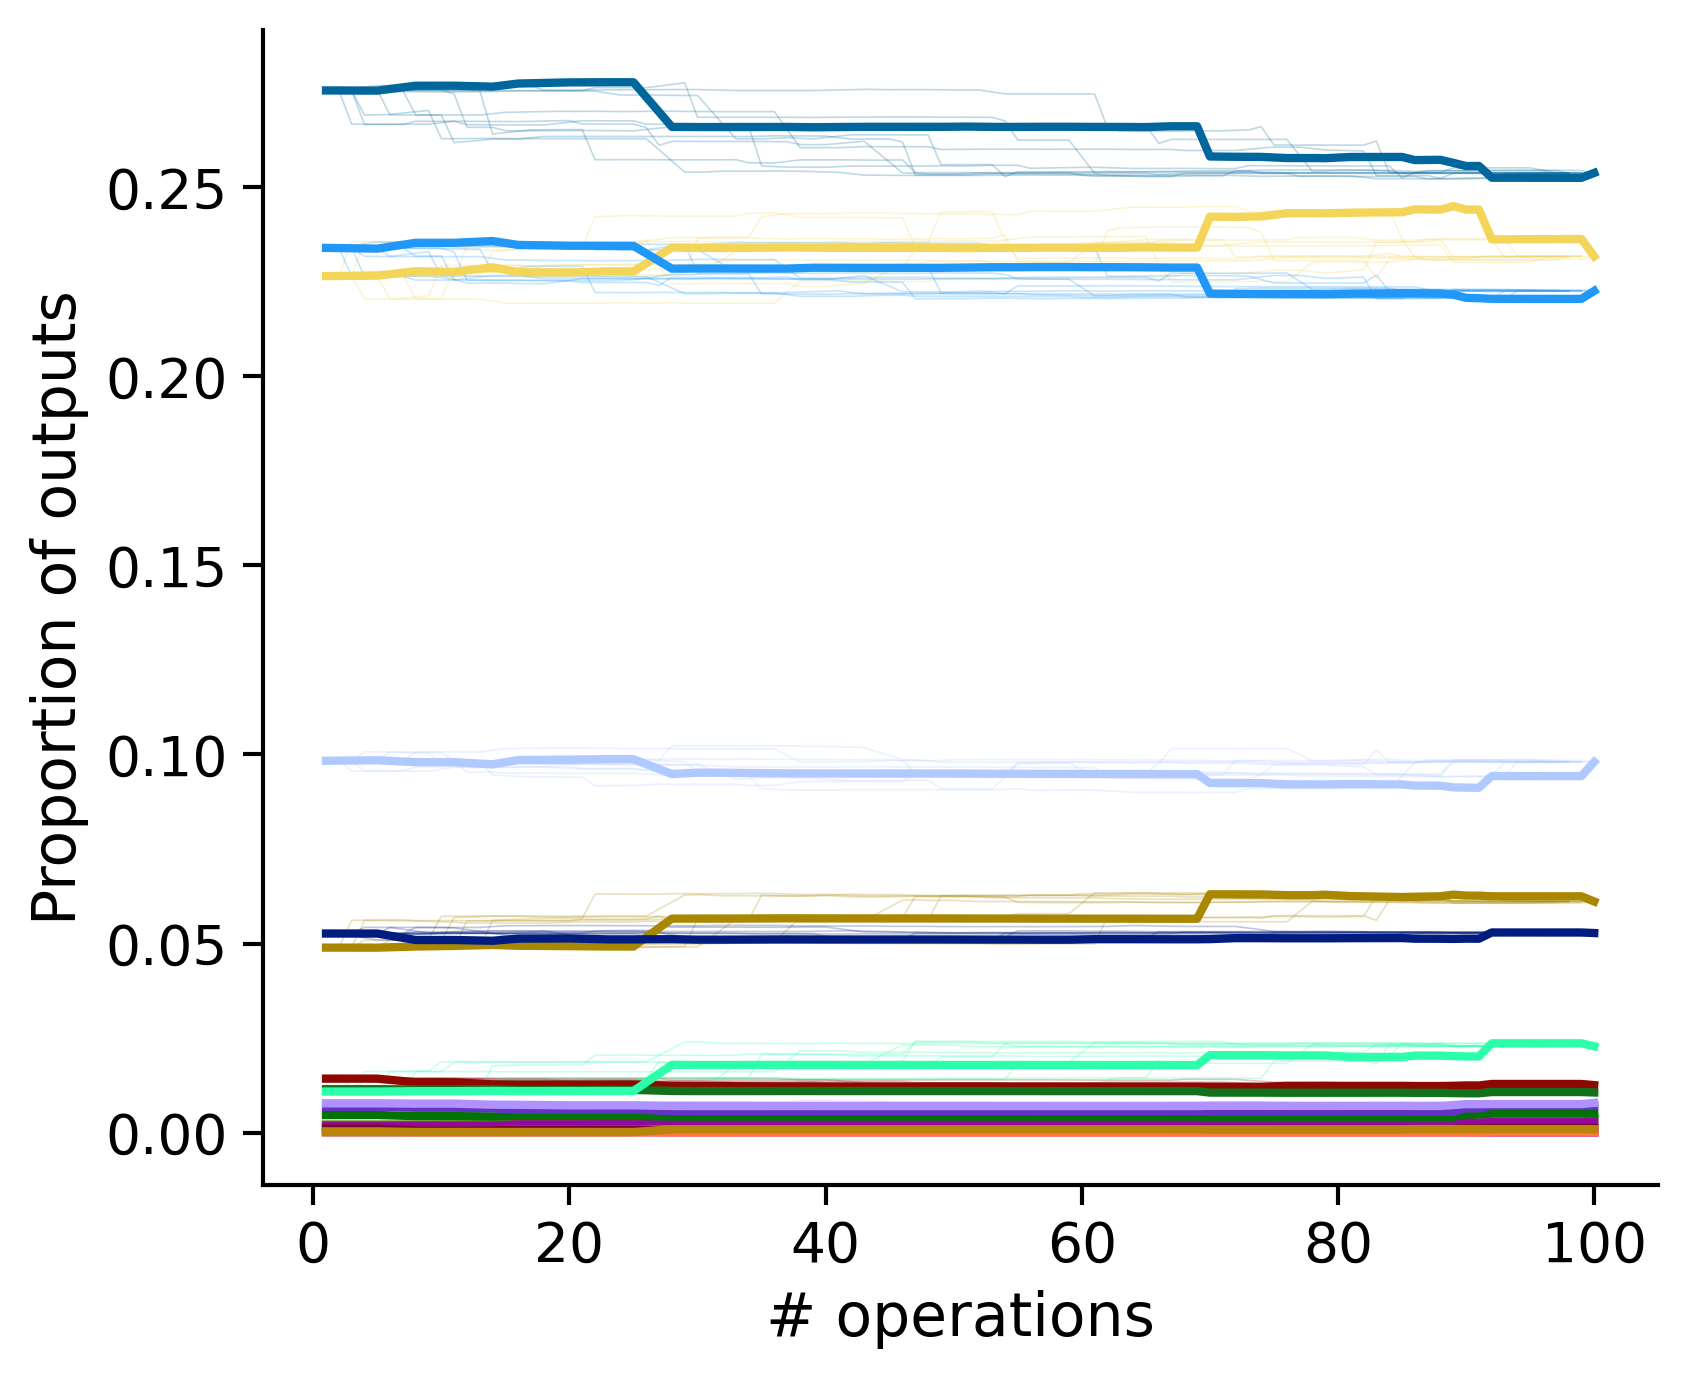
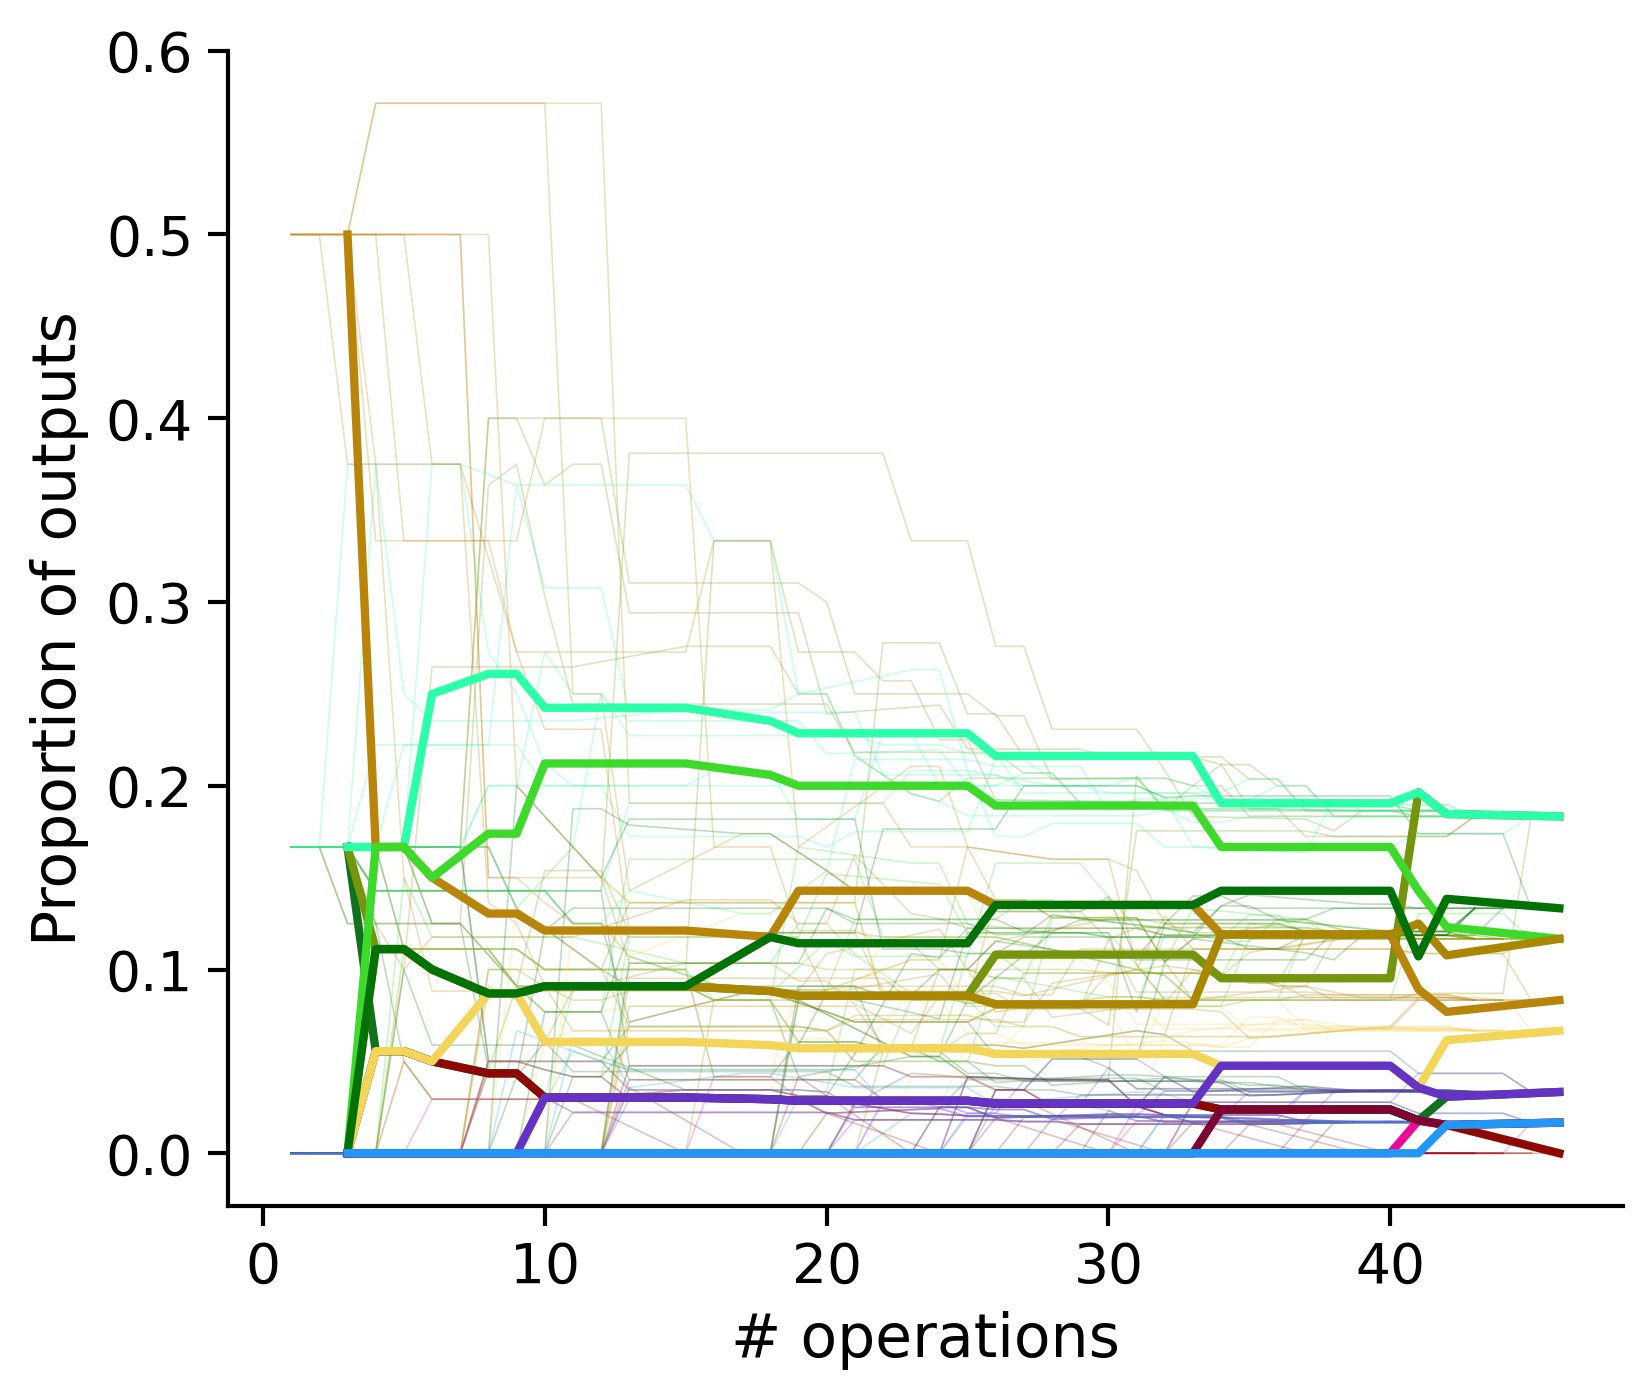
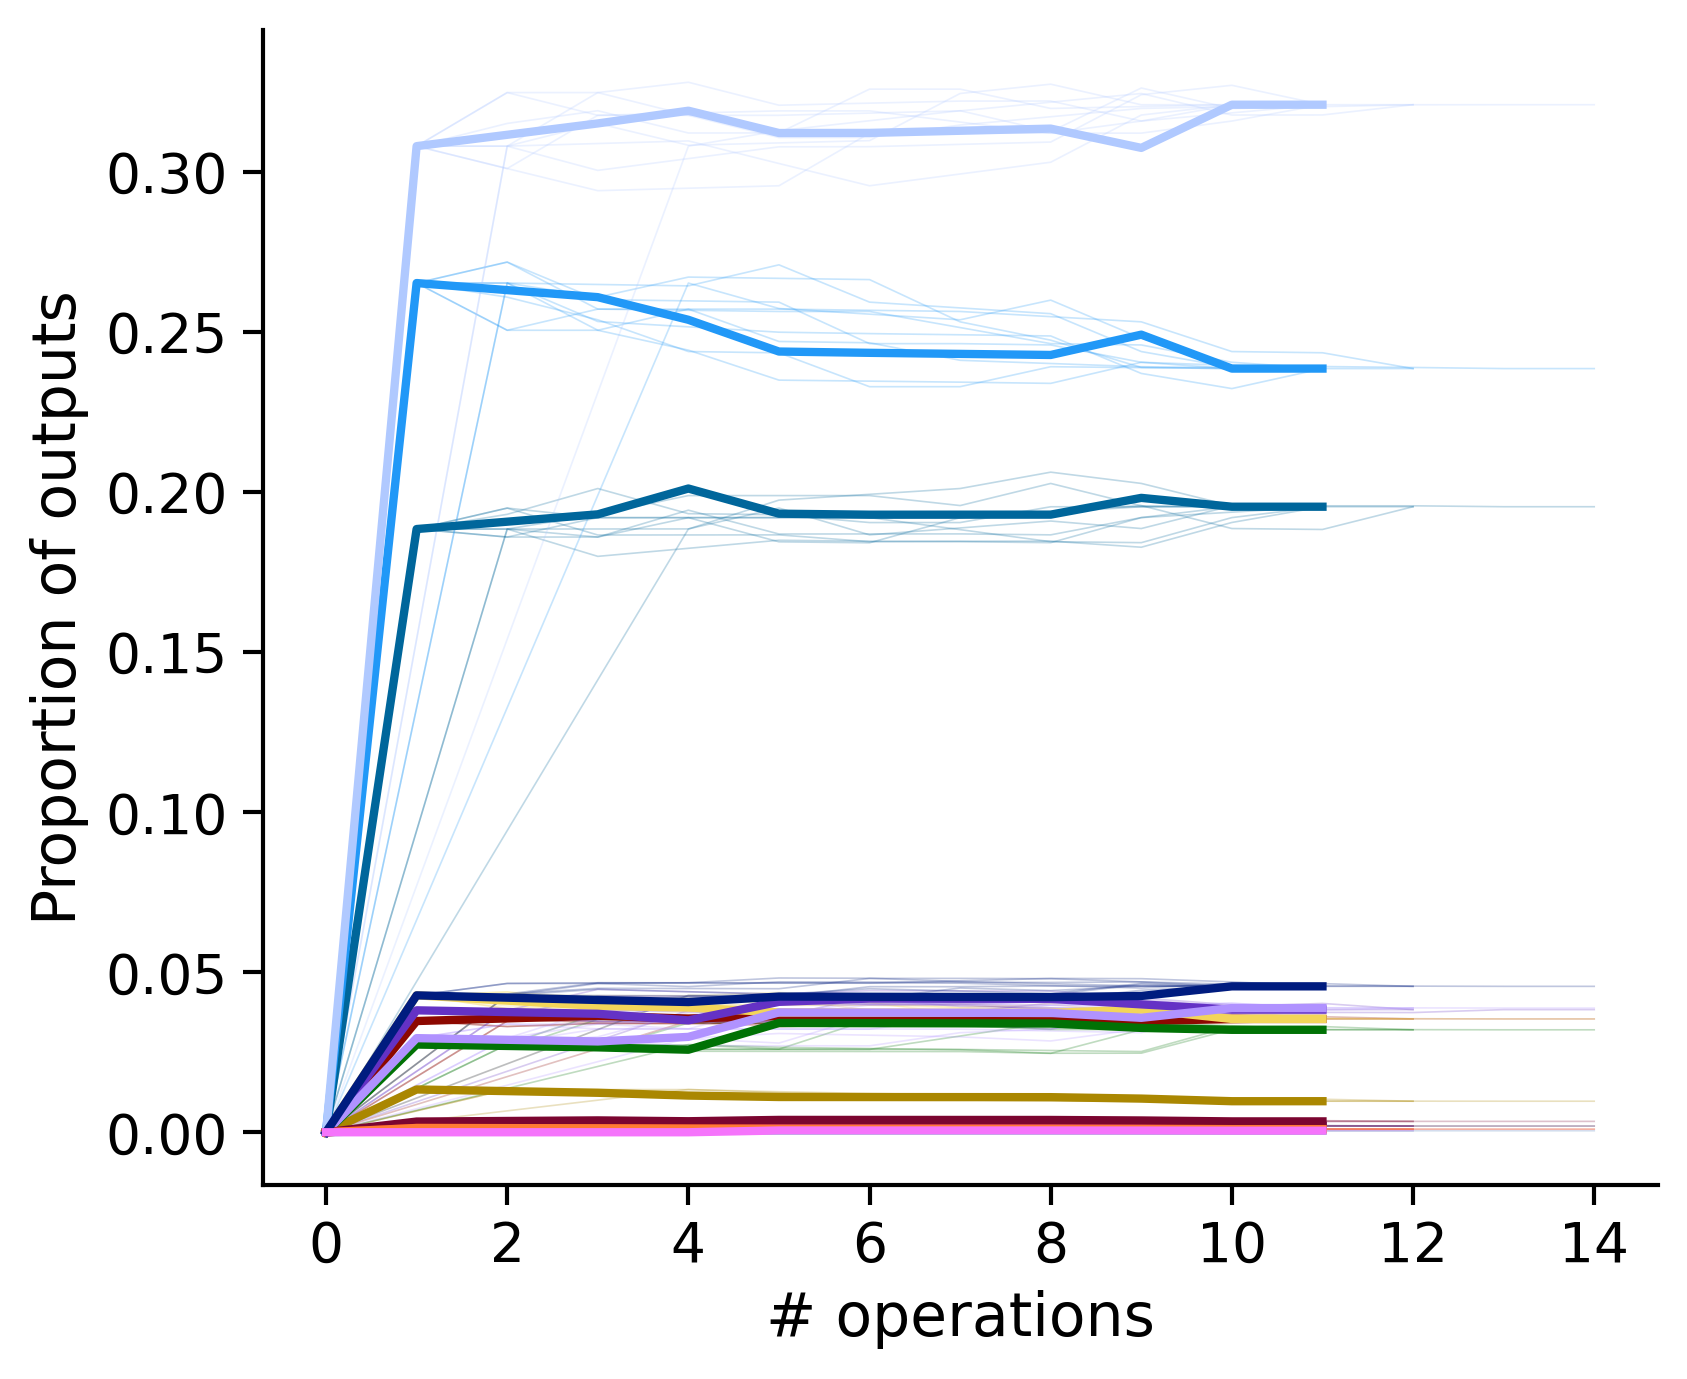
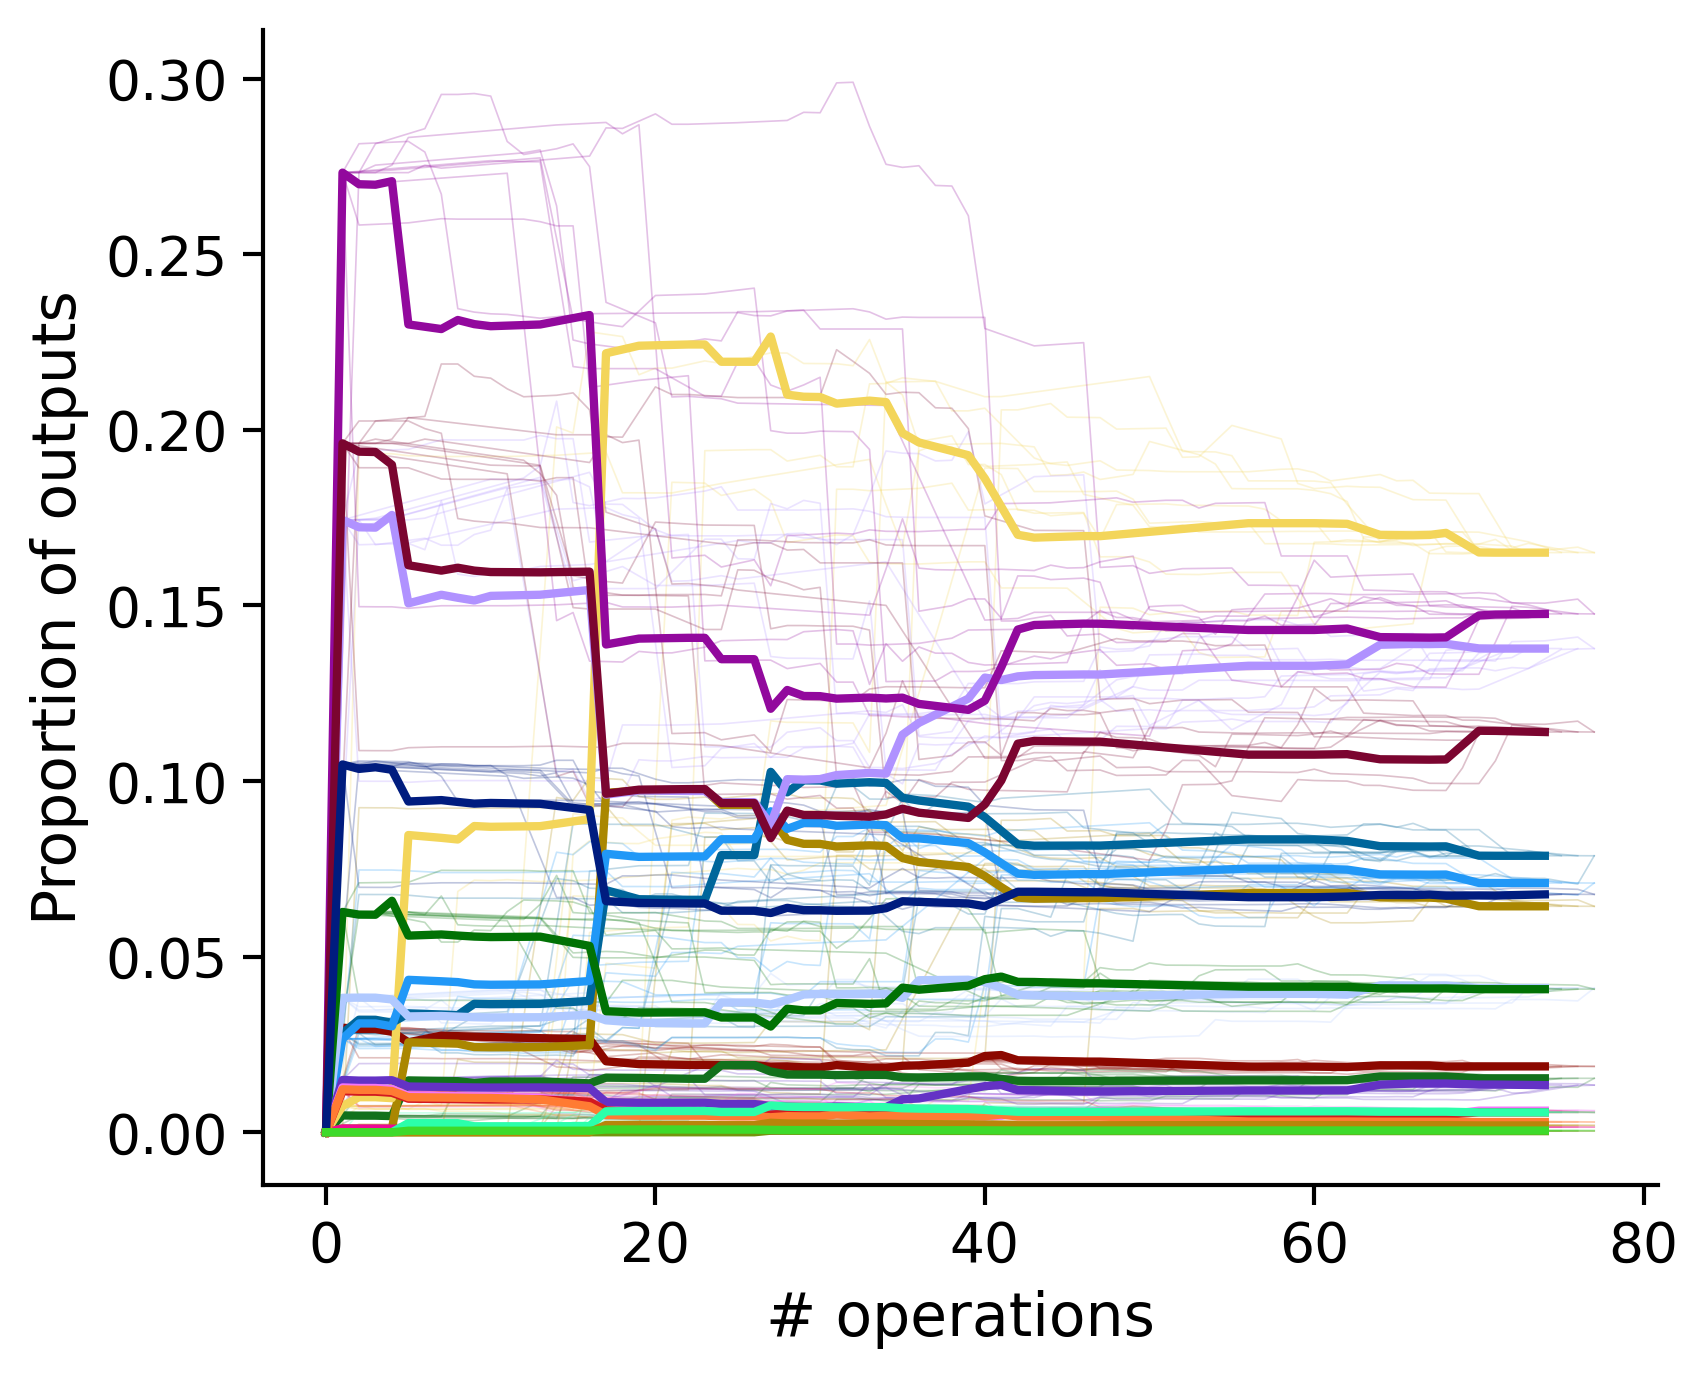
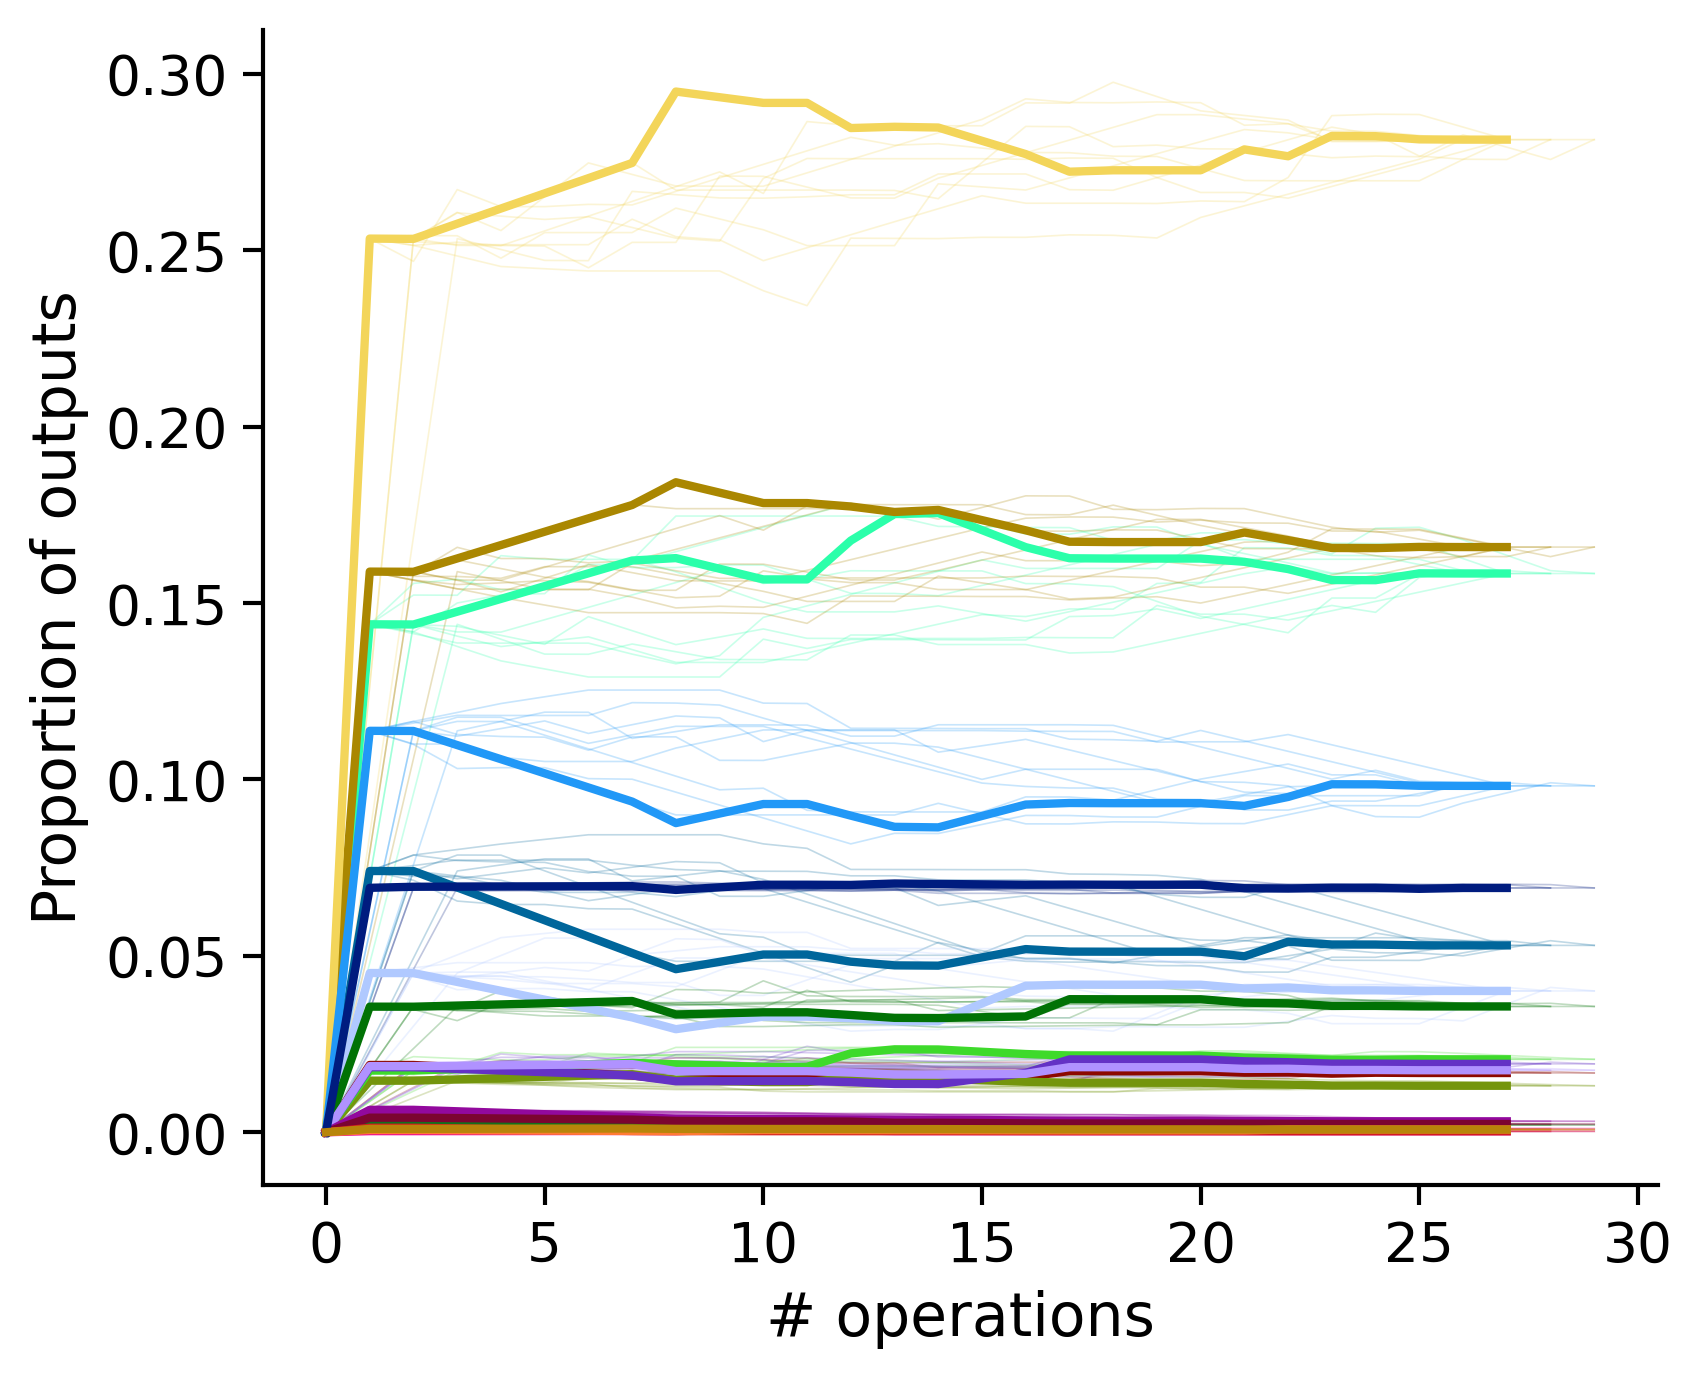
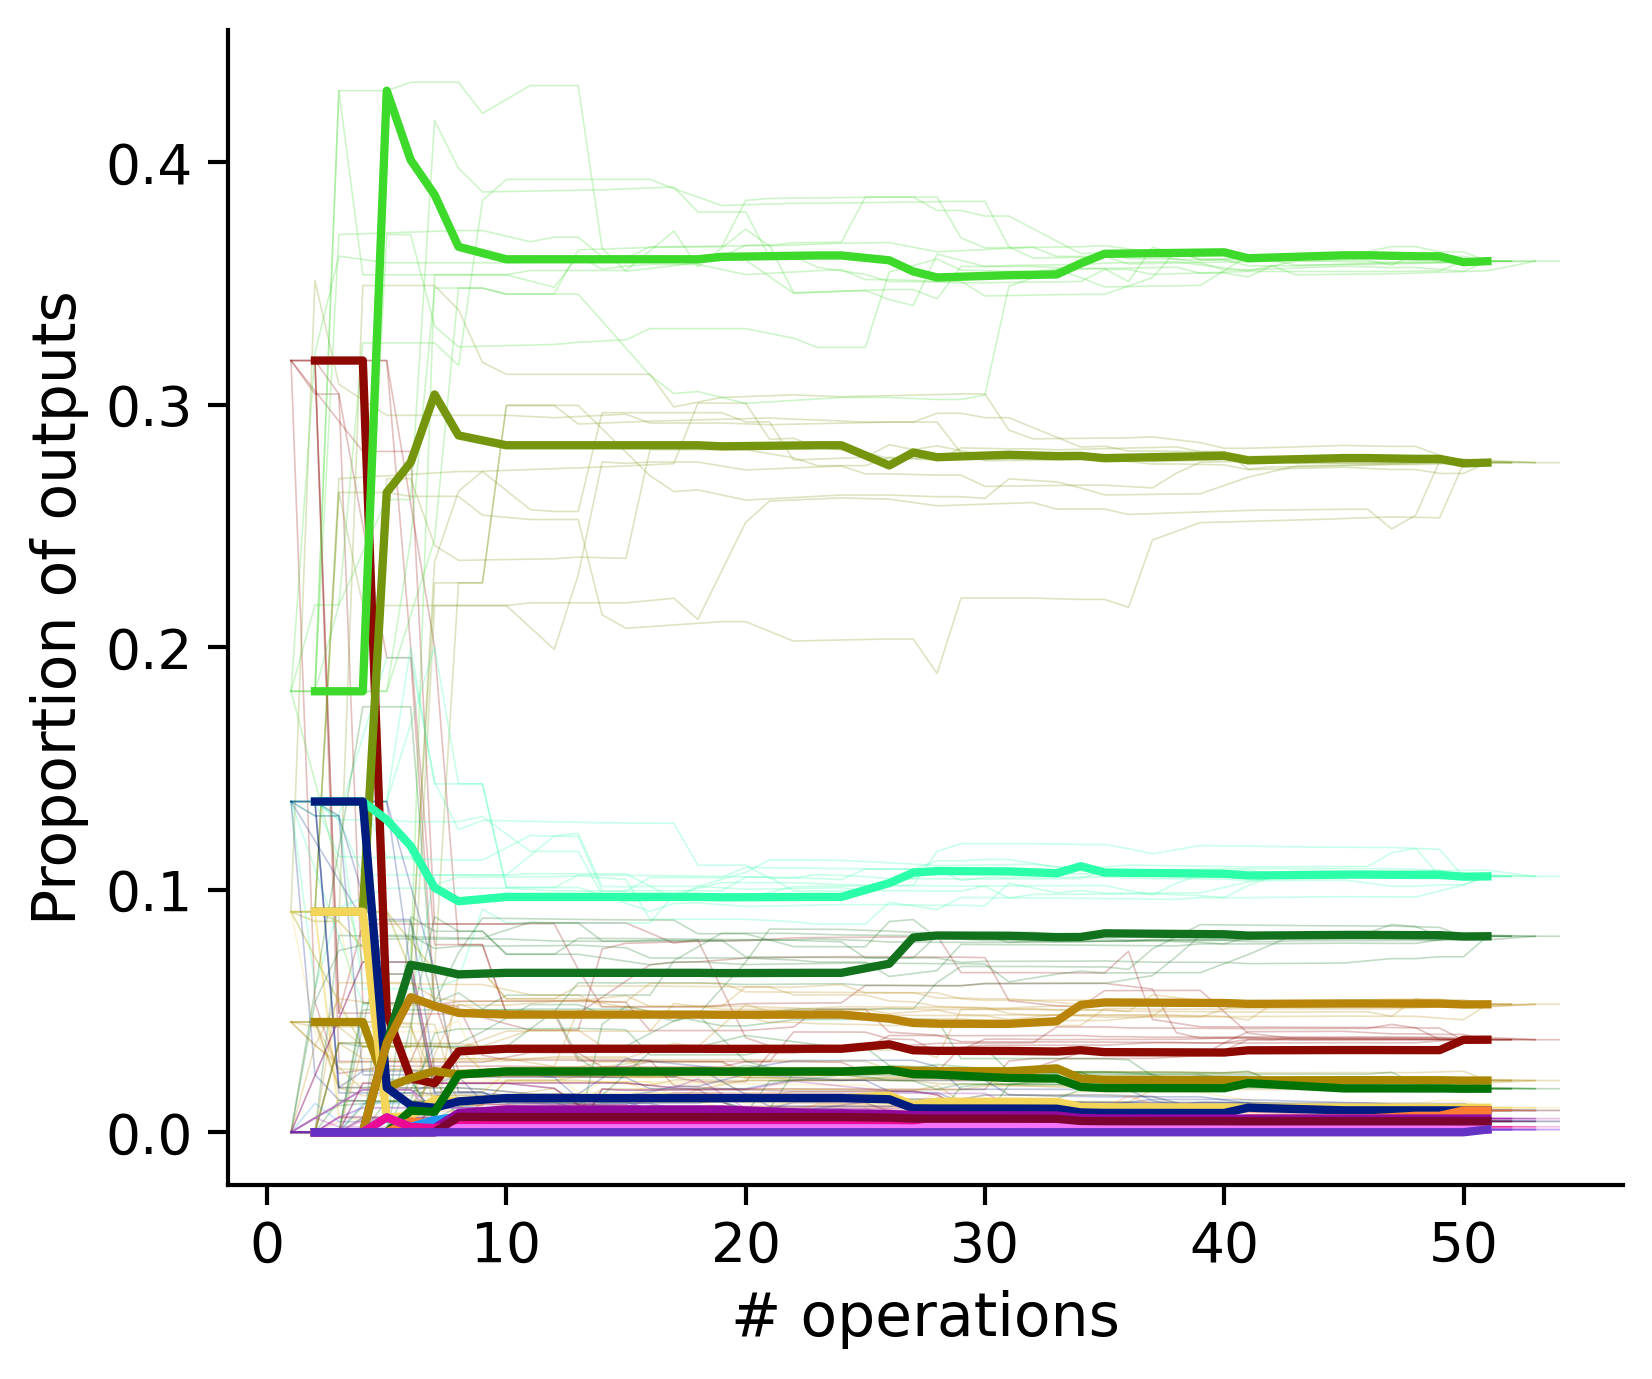
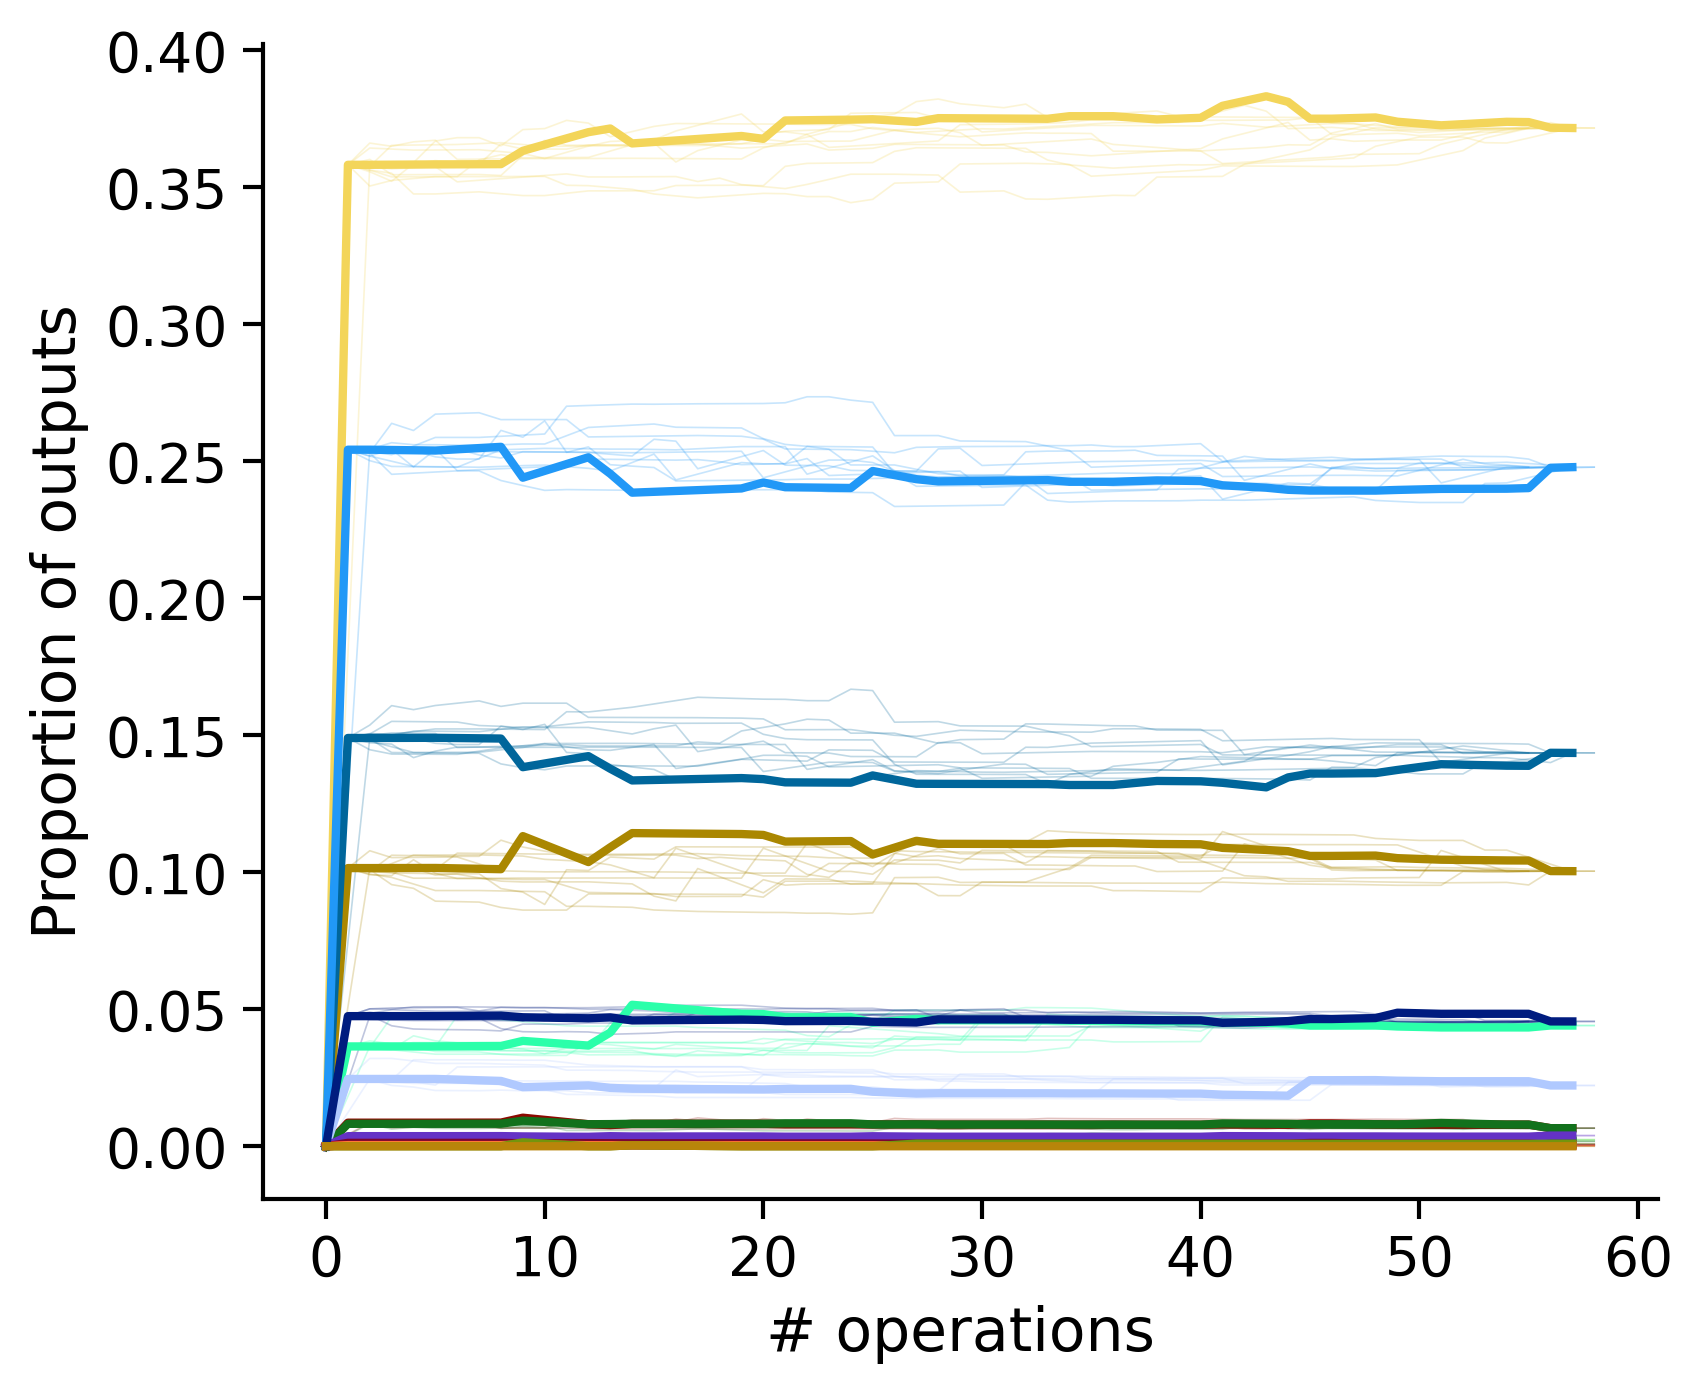
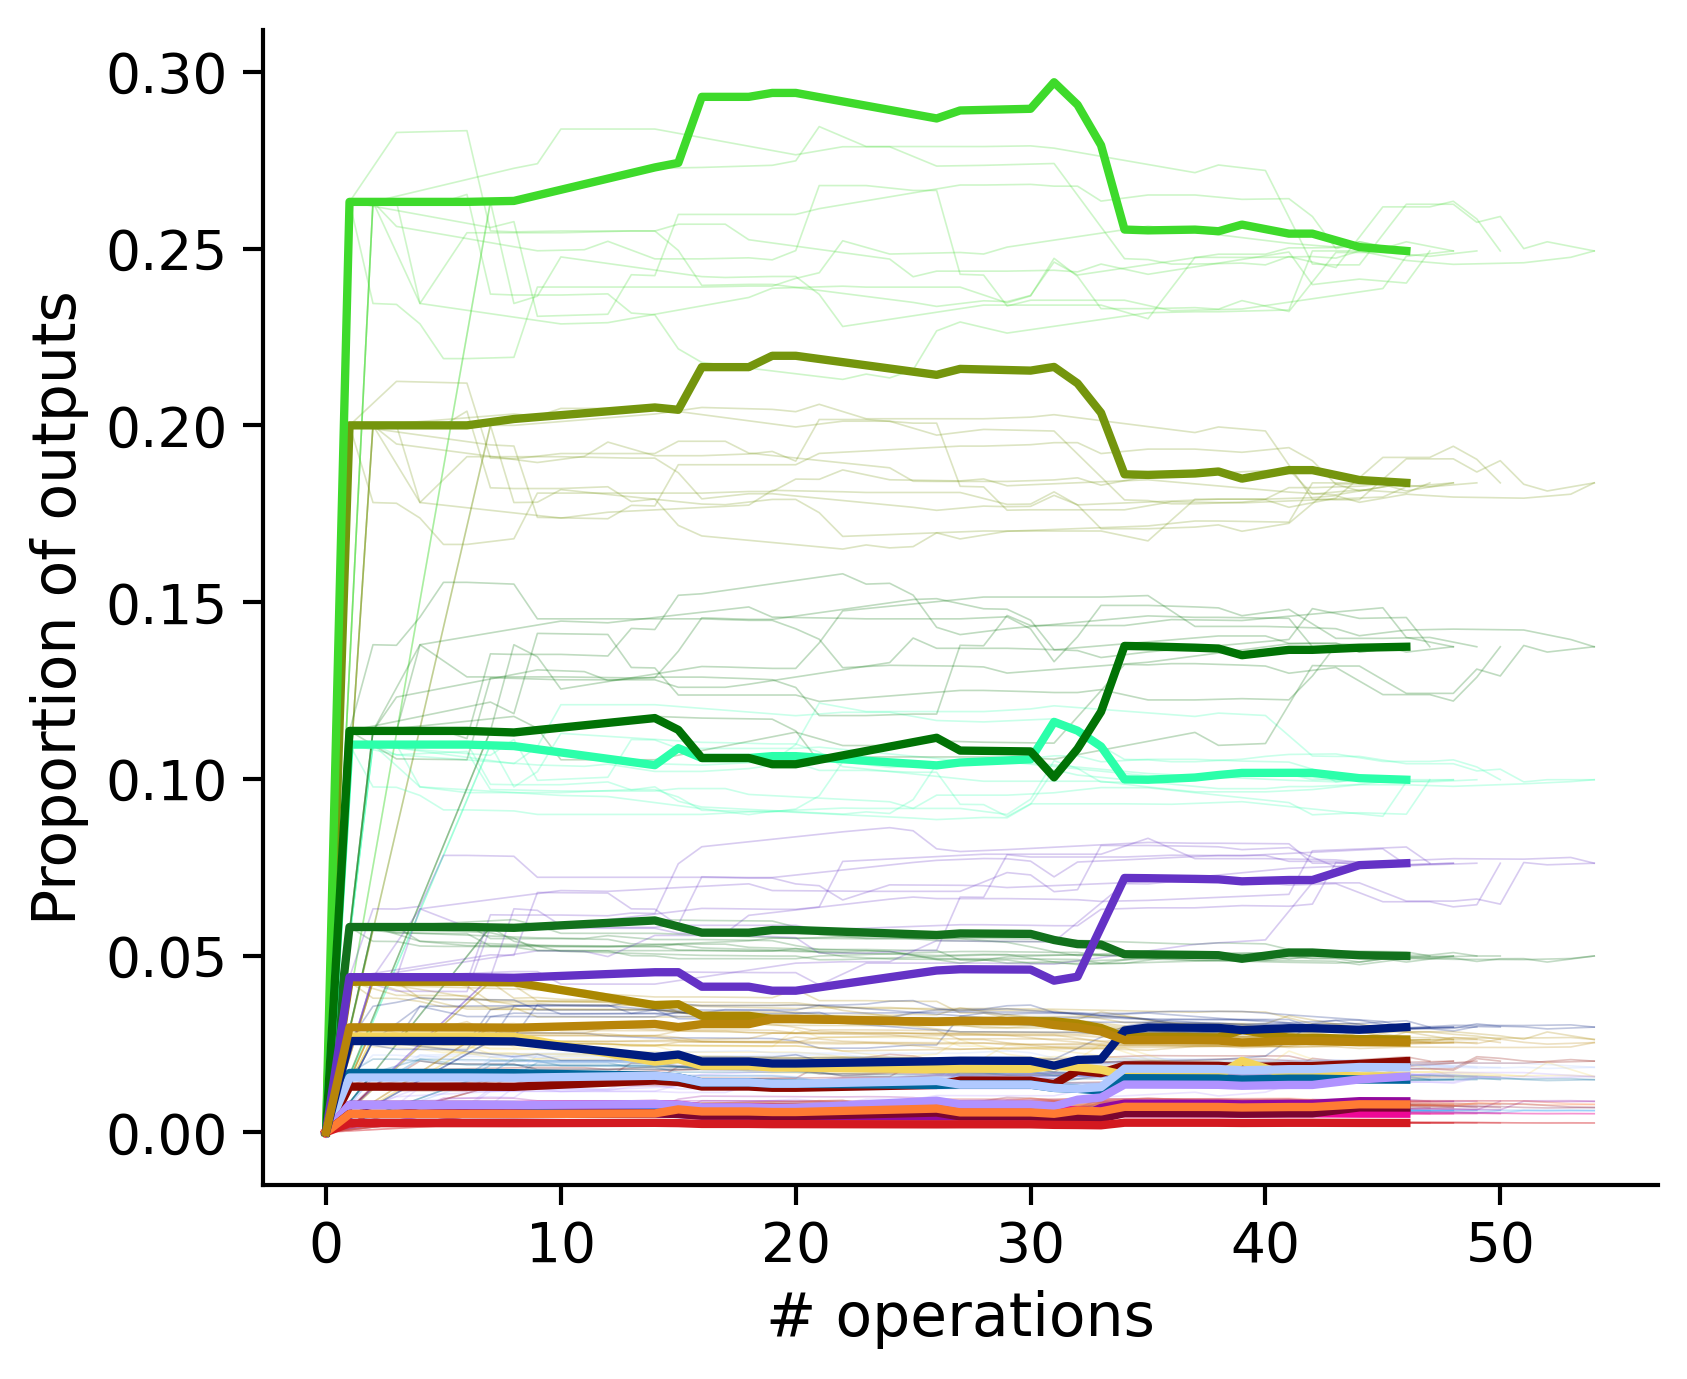
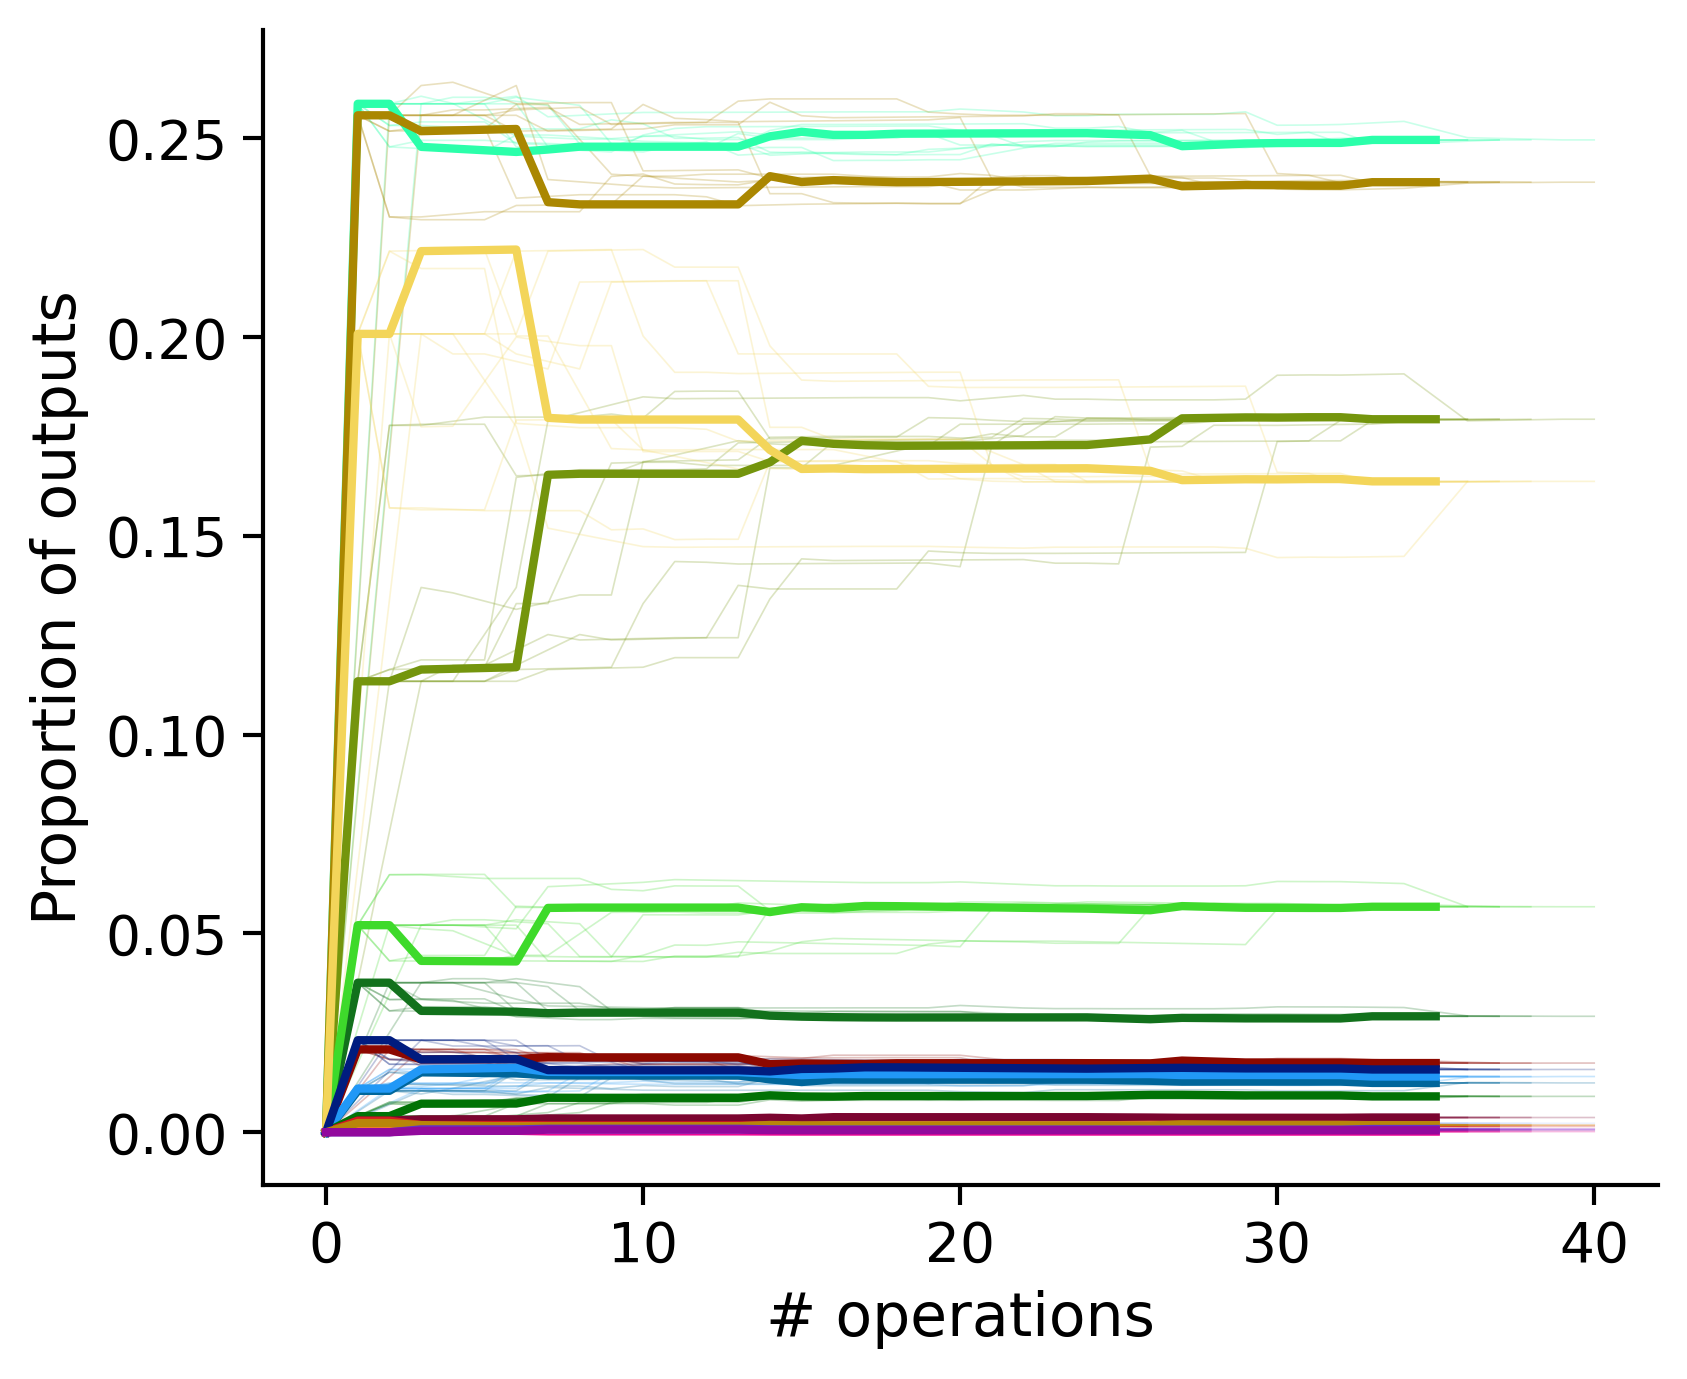
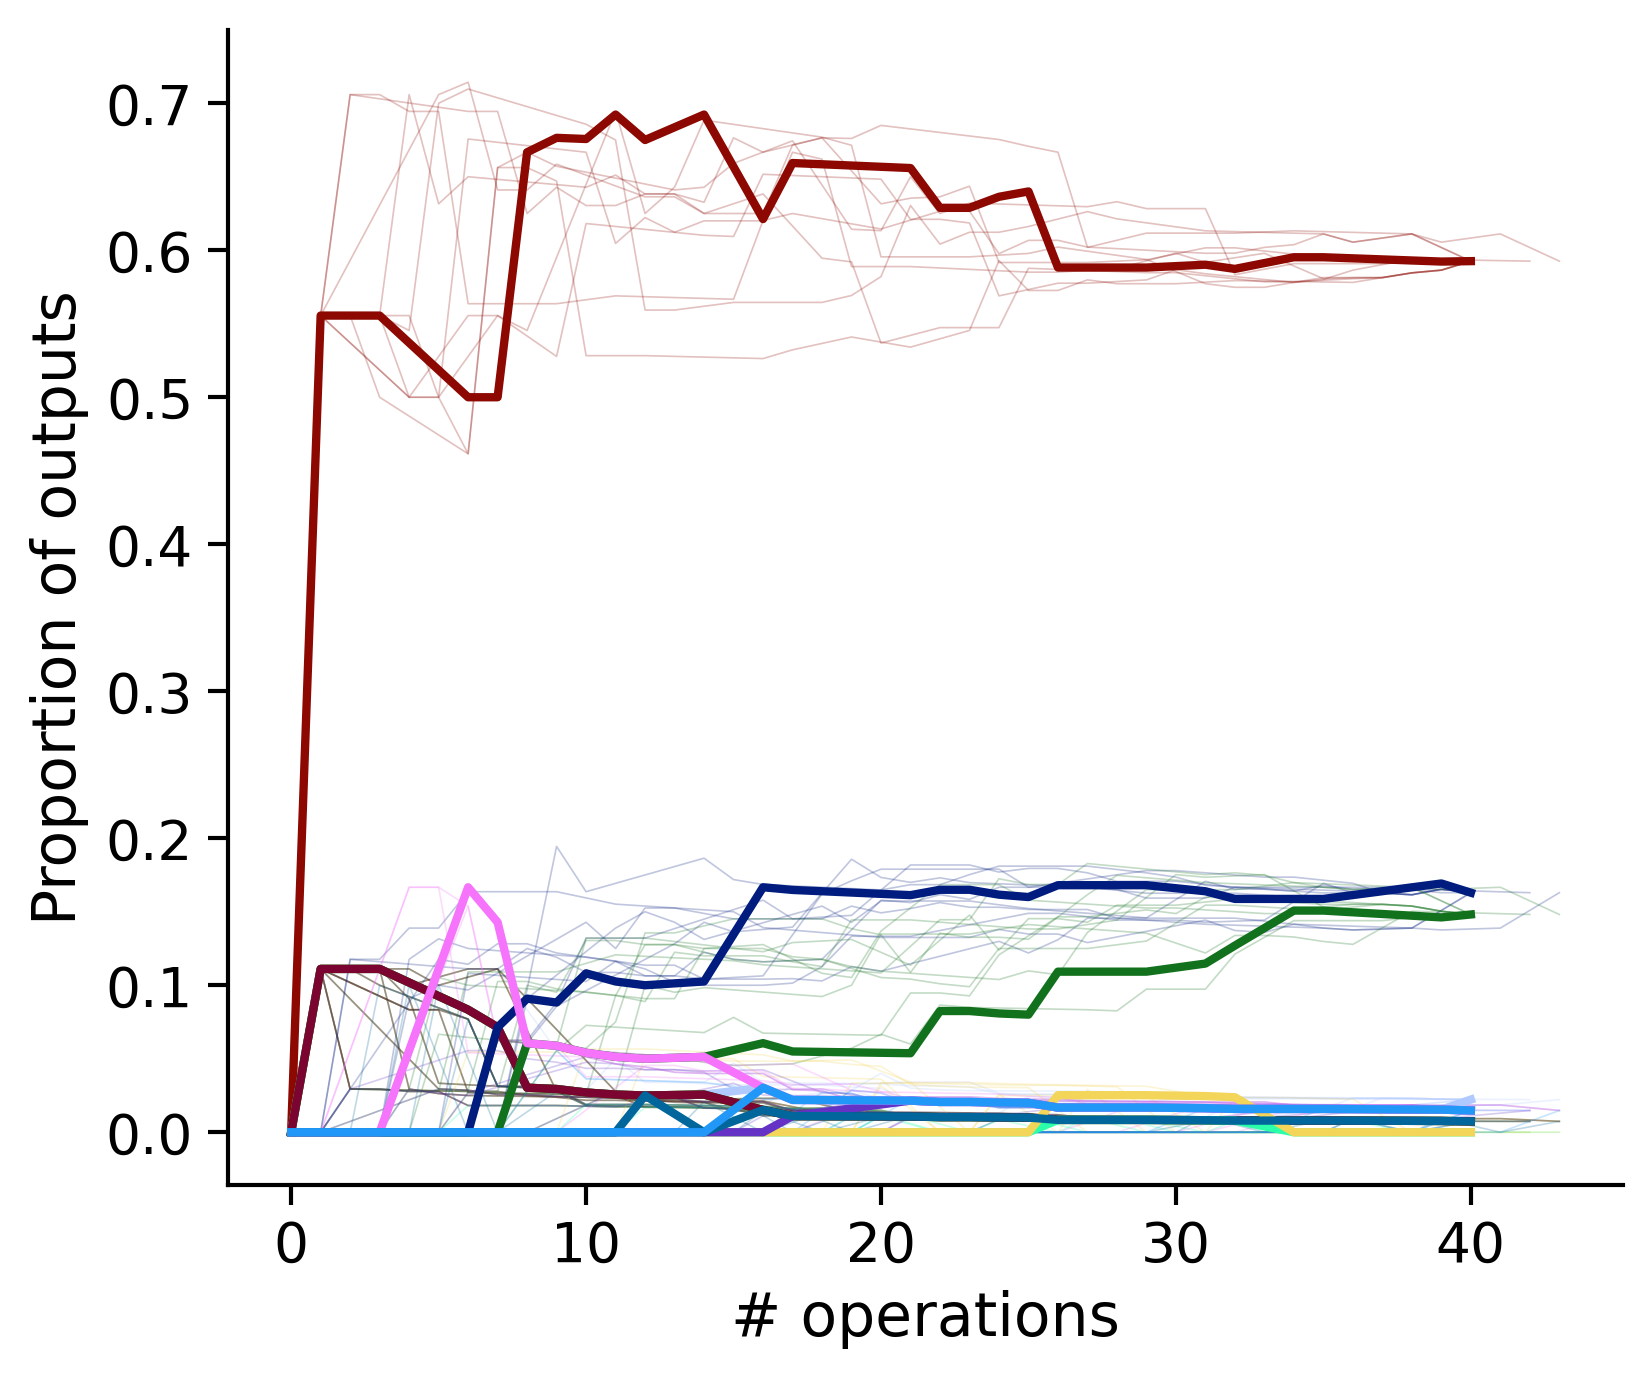
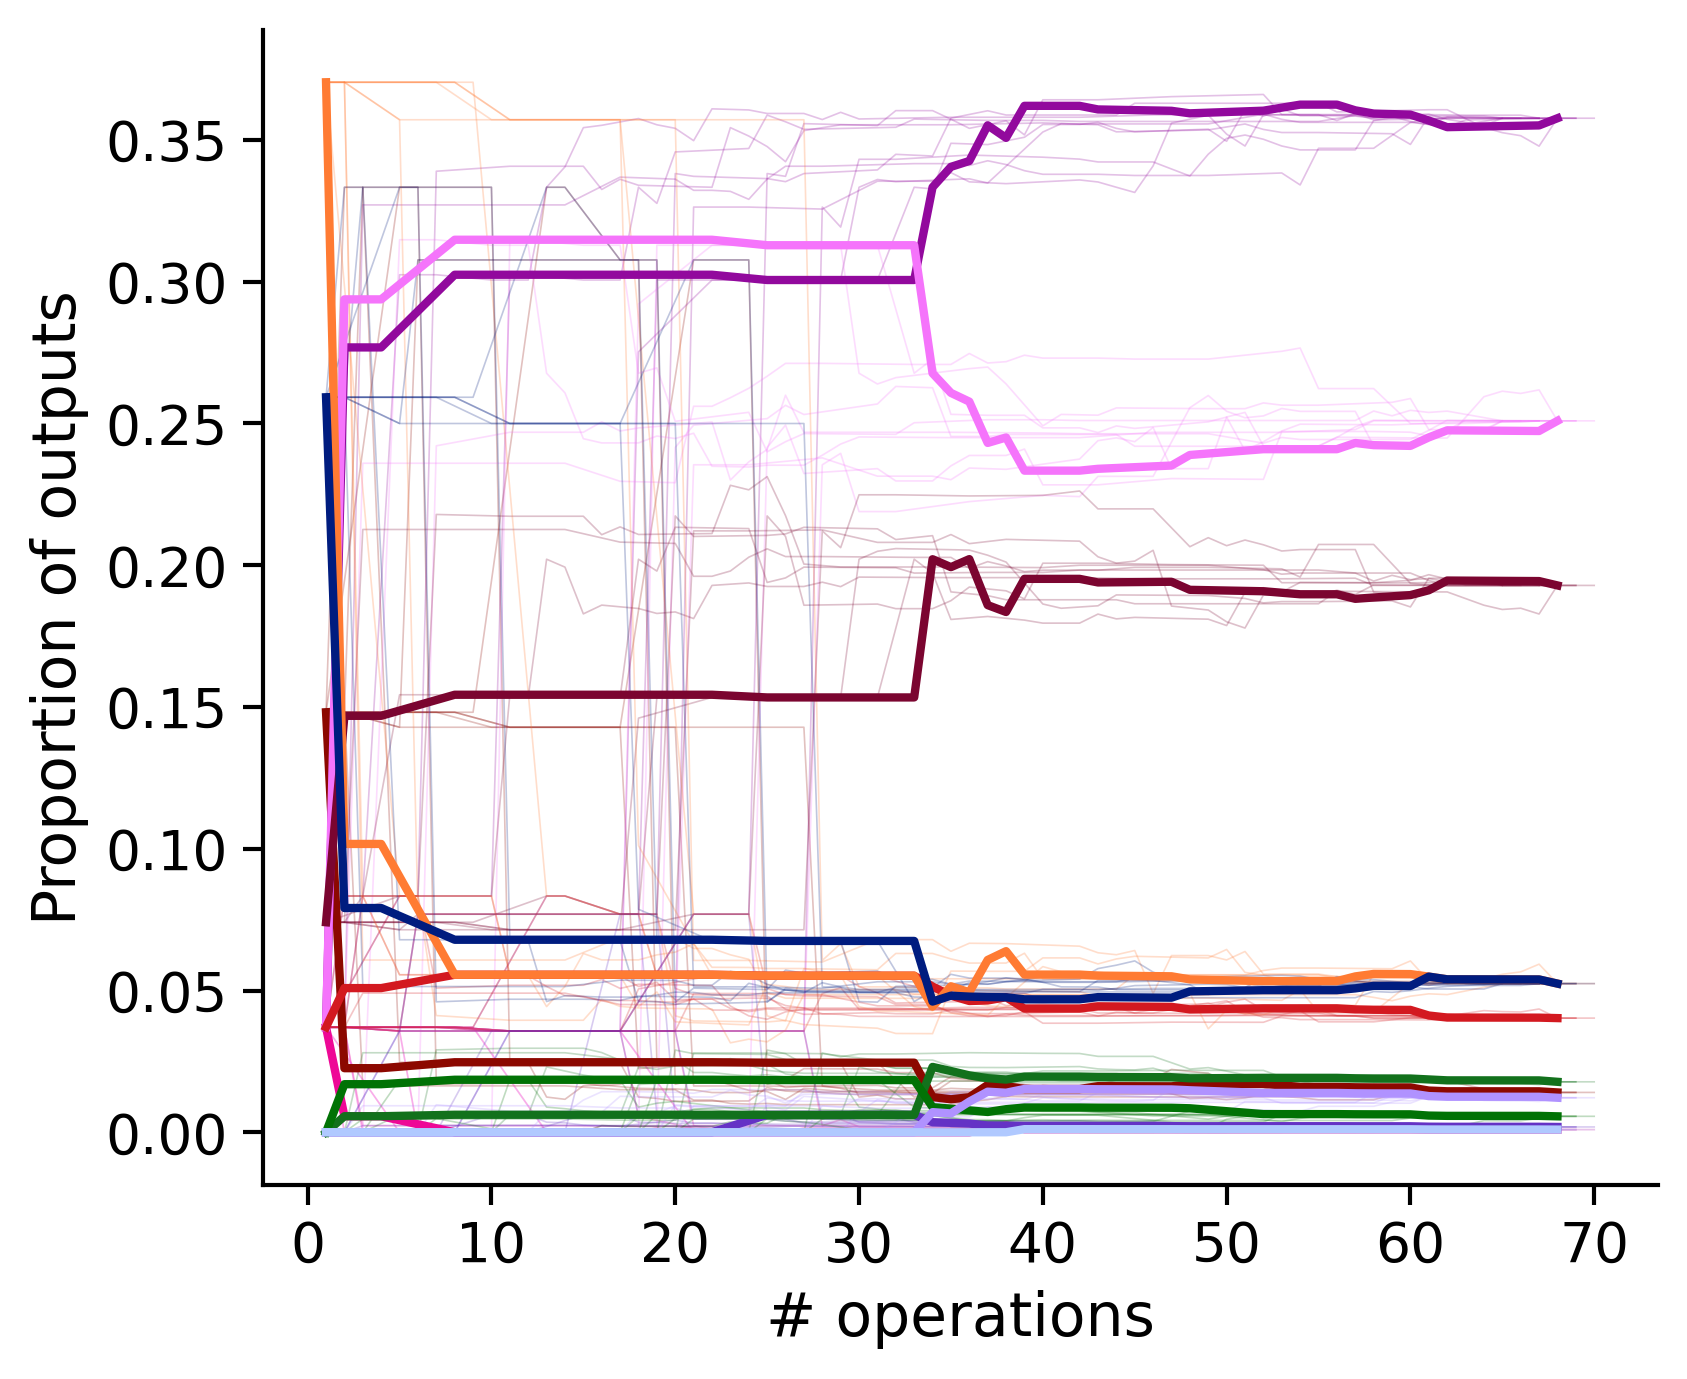
Proportion of outouts metric
Historical ordering
Features over proofreading
aibs_metamodel_mtypes_v661_v2).
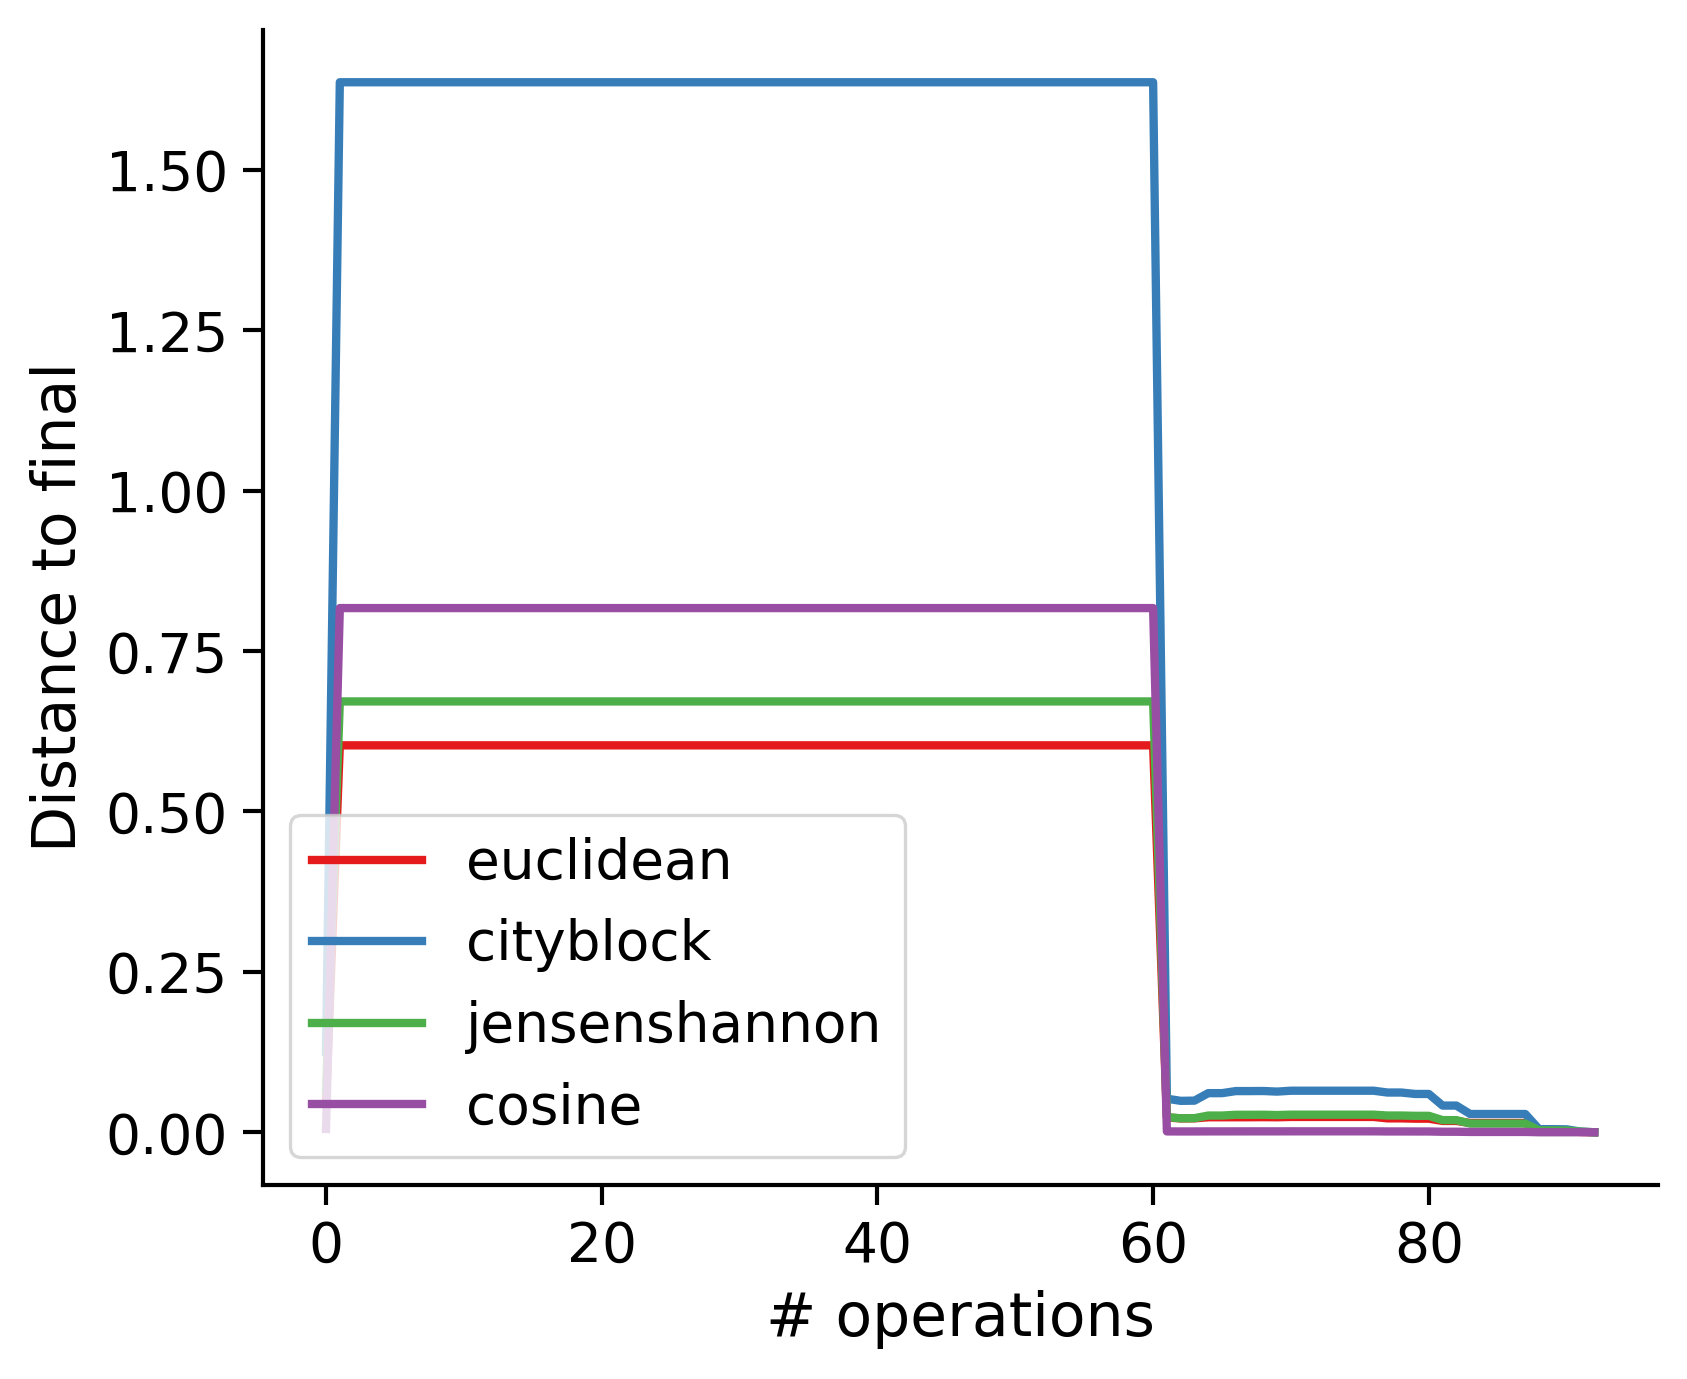
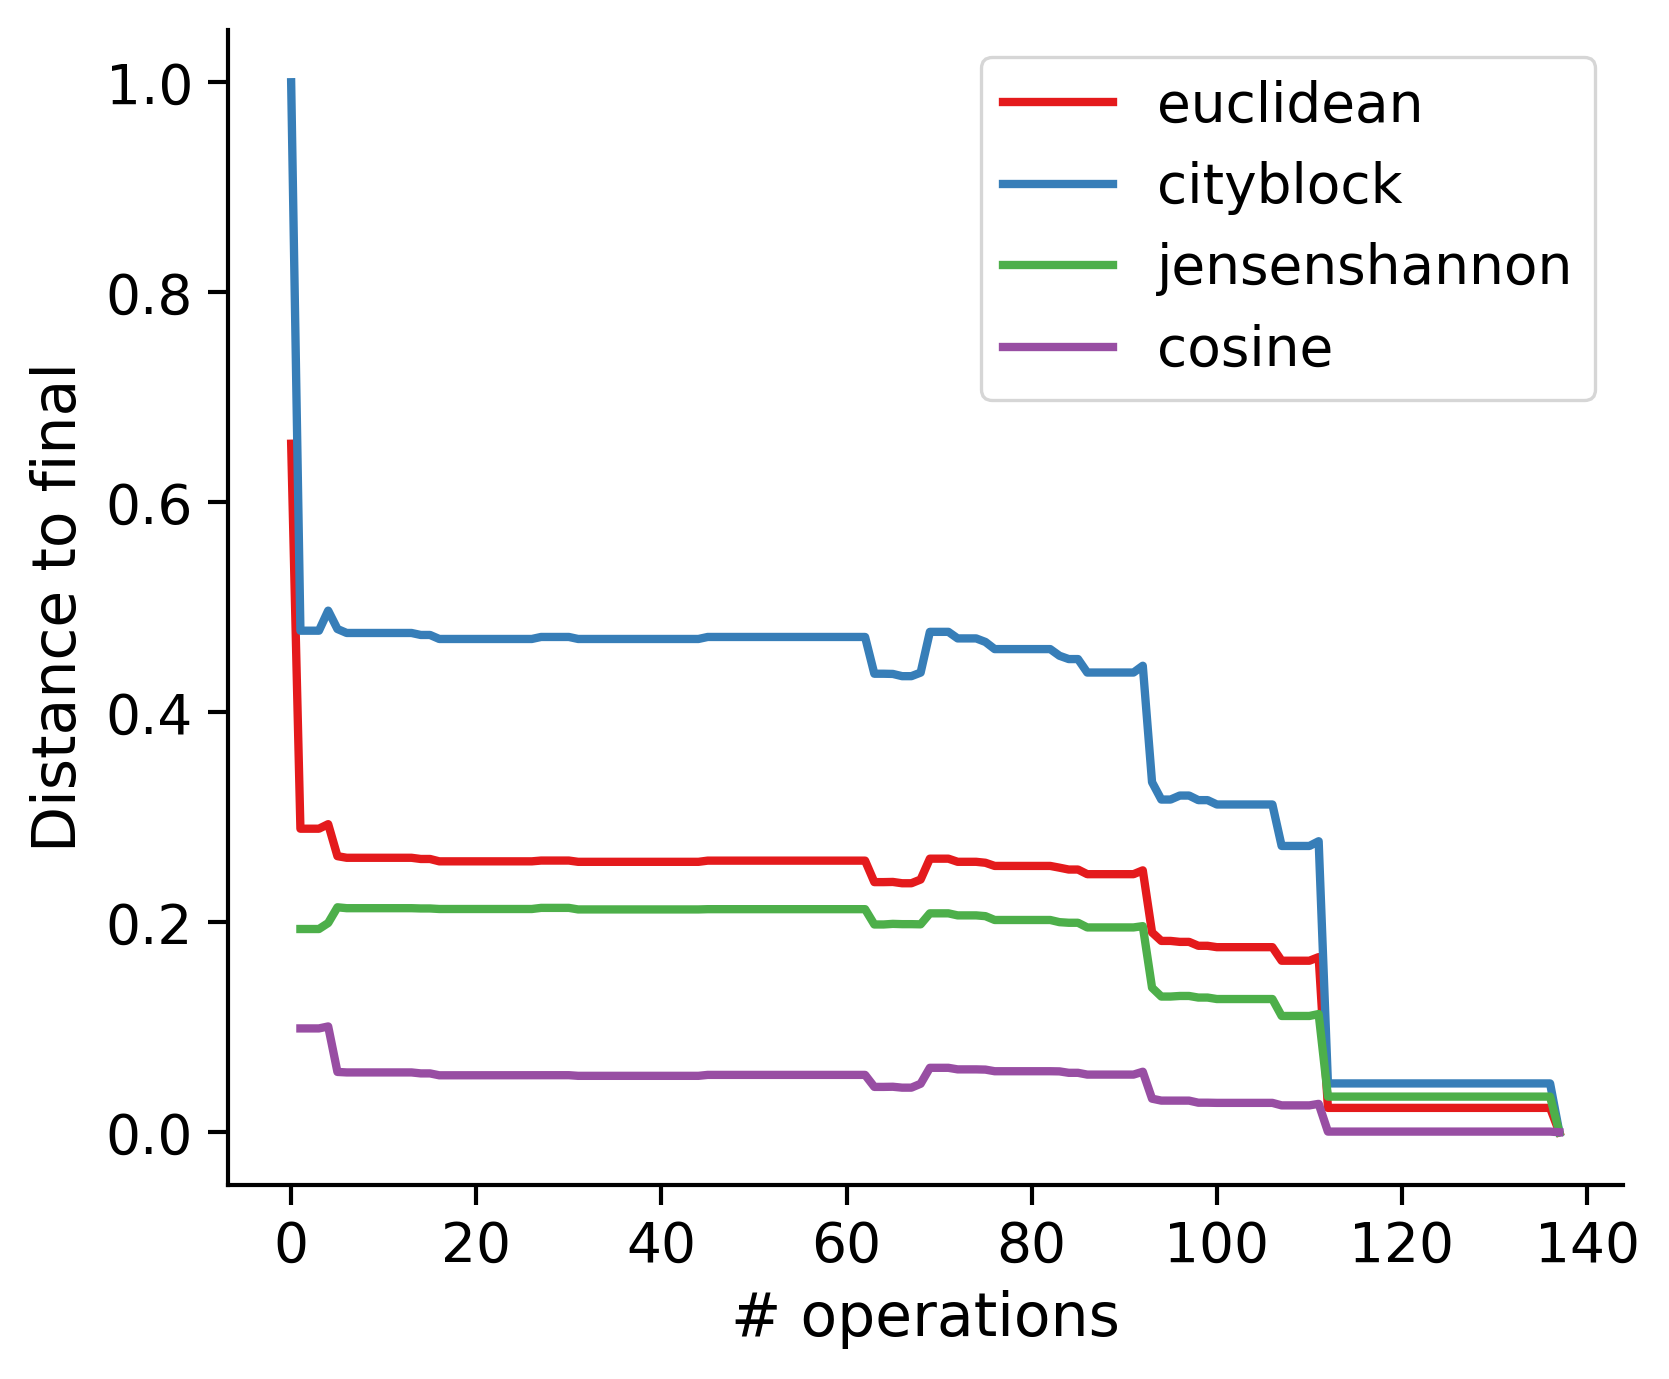
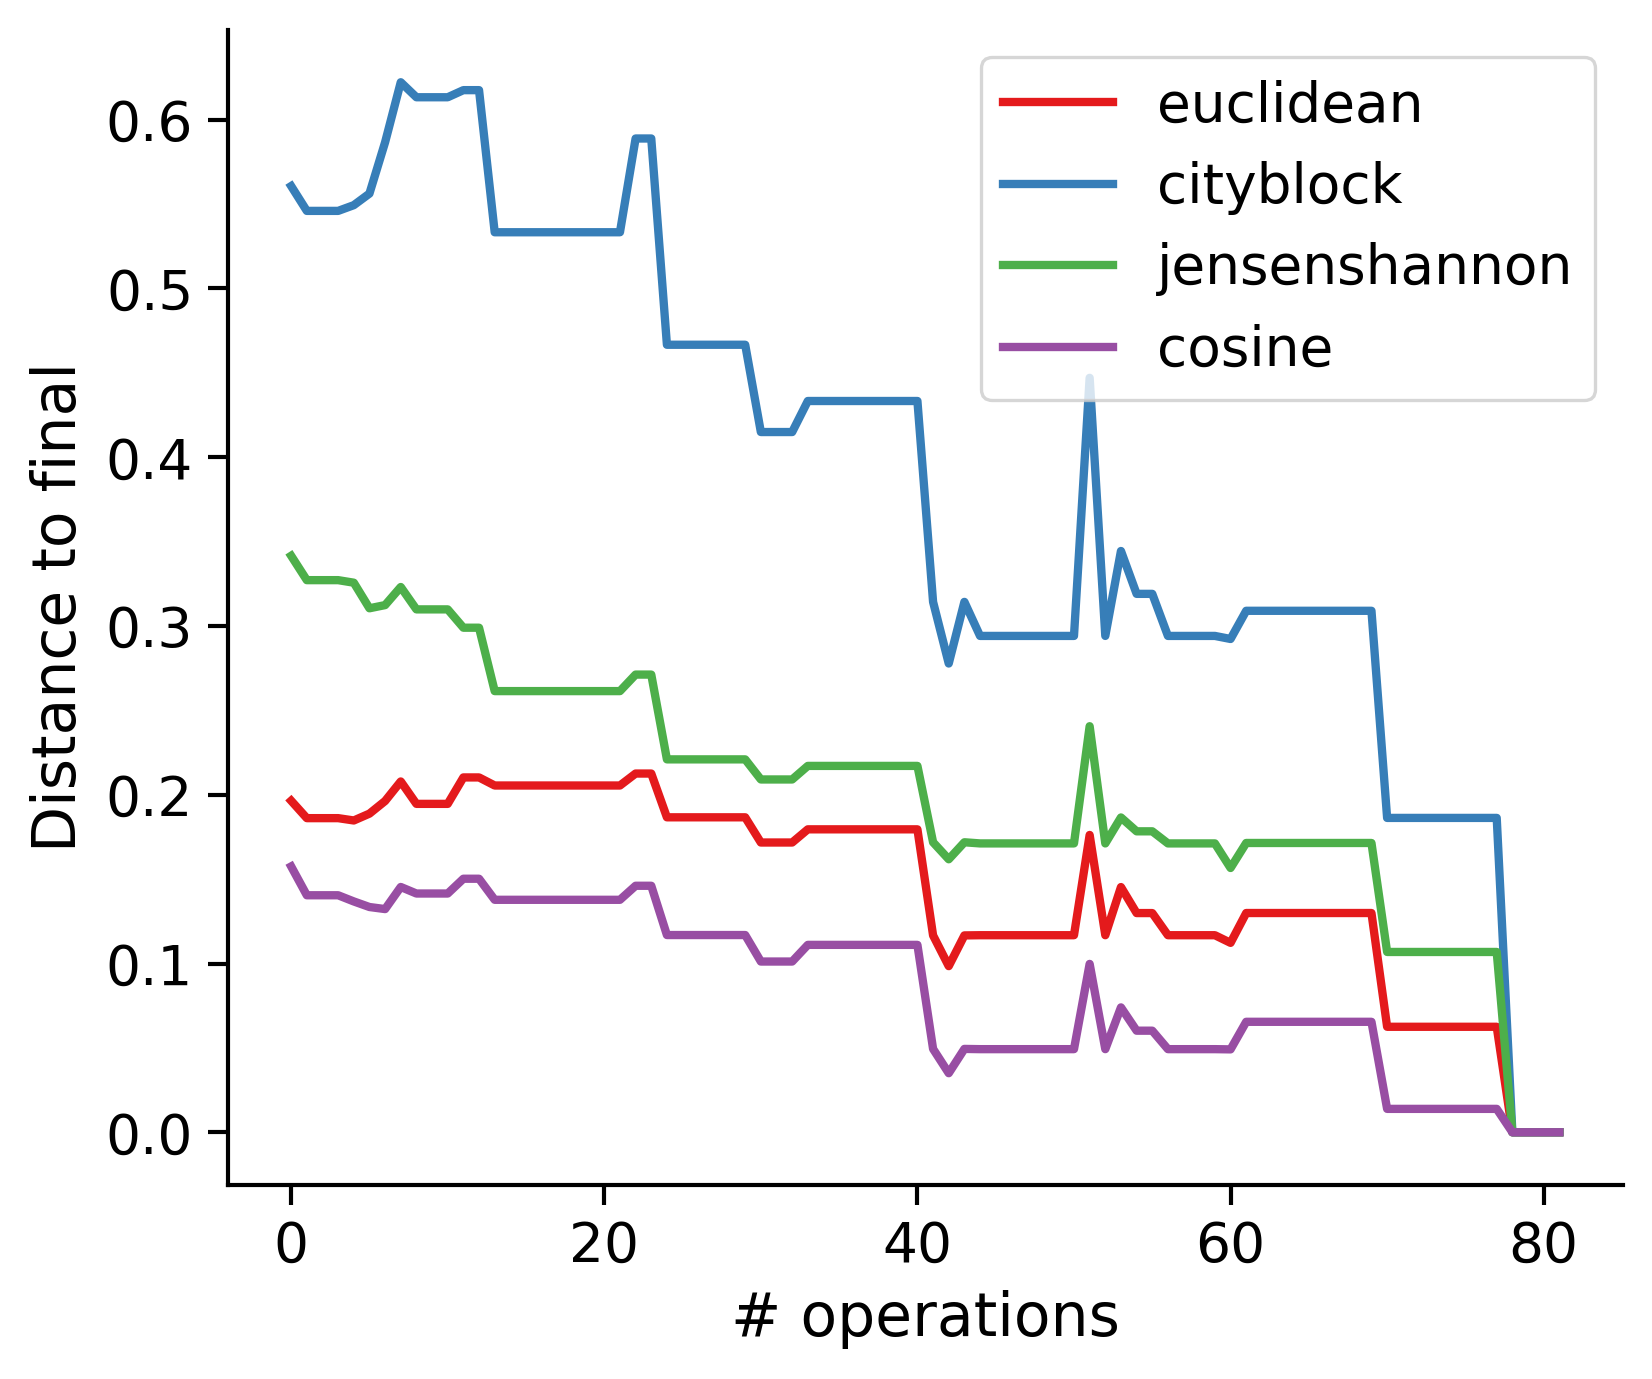
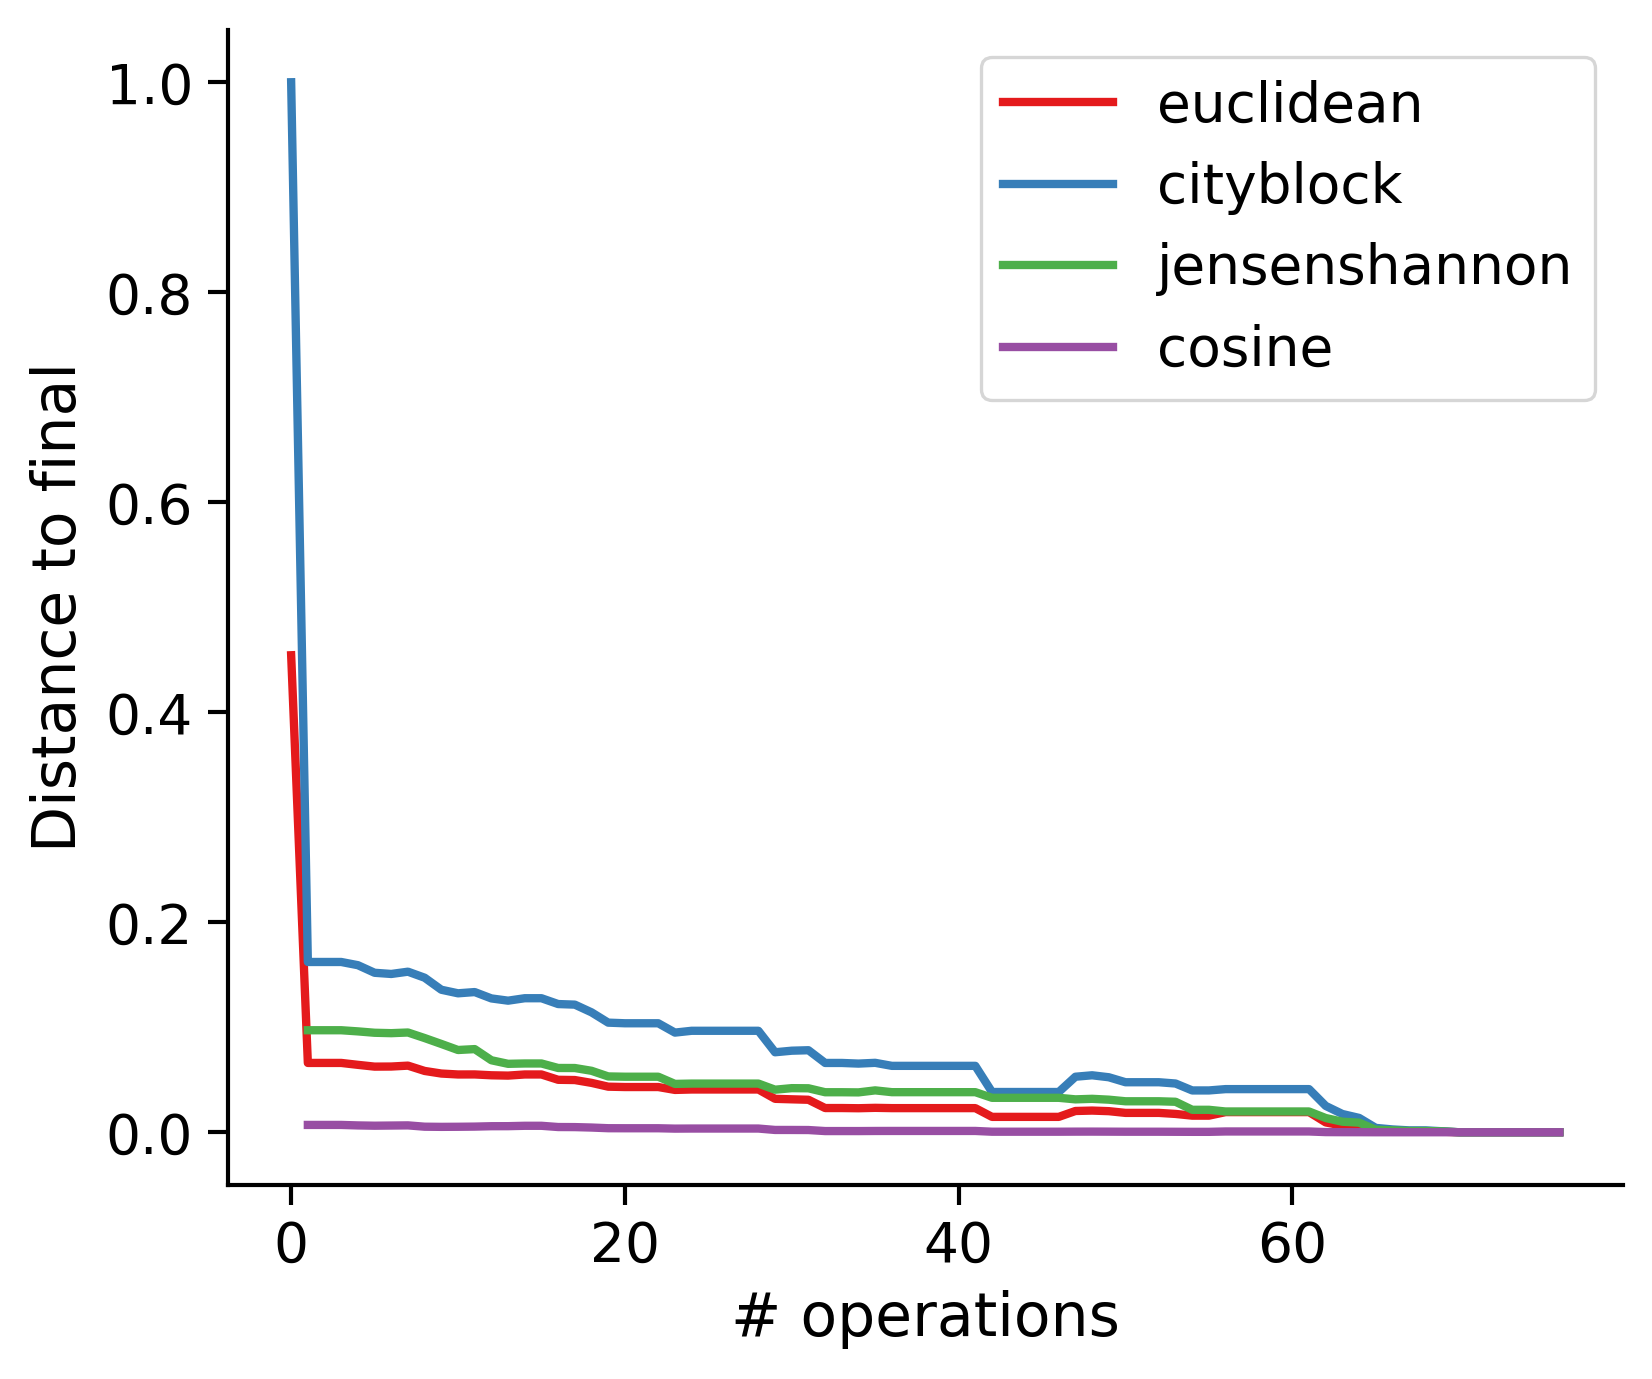
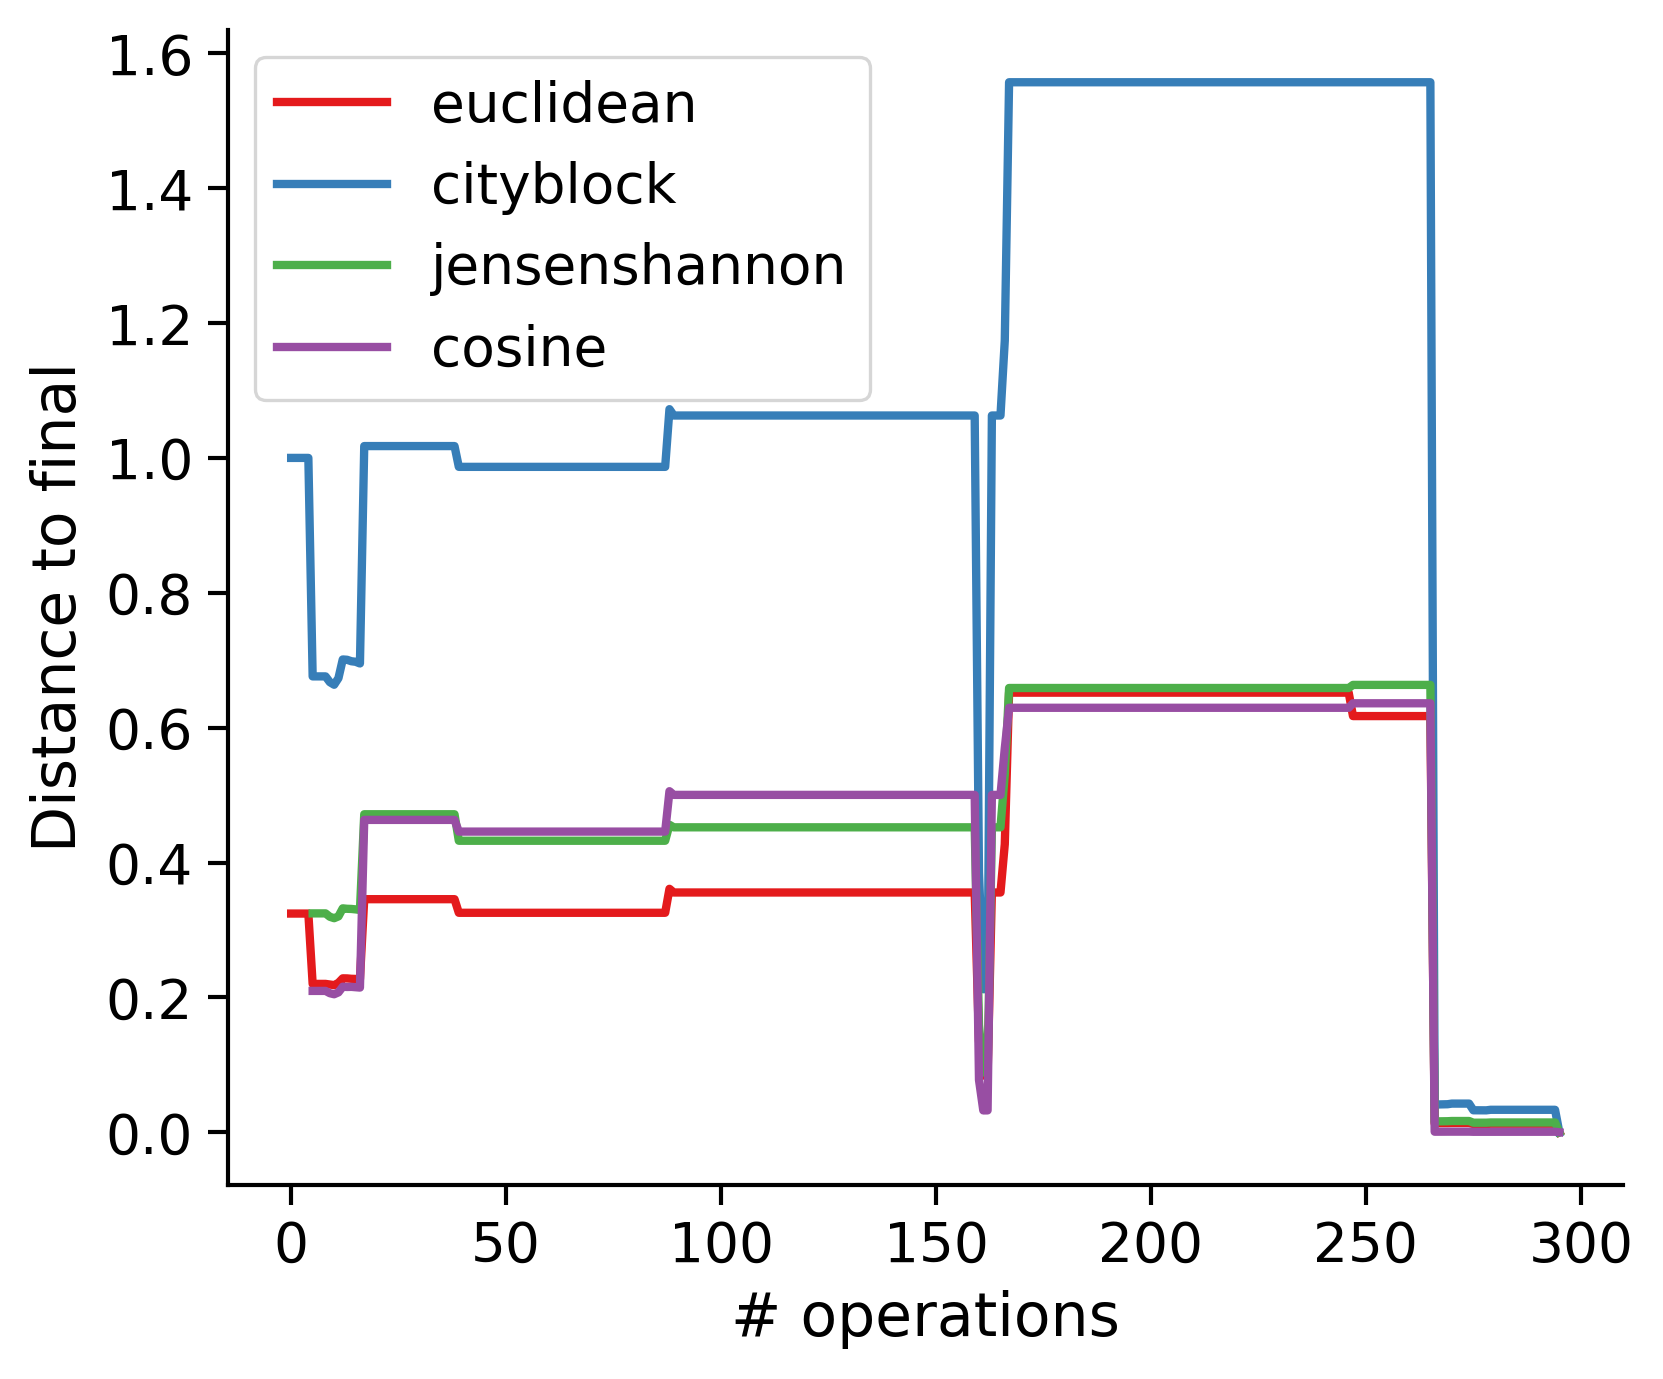
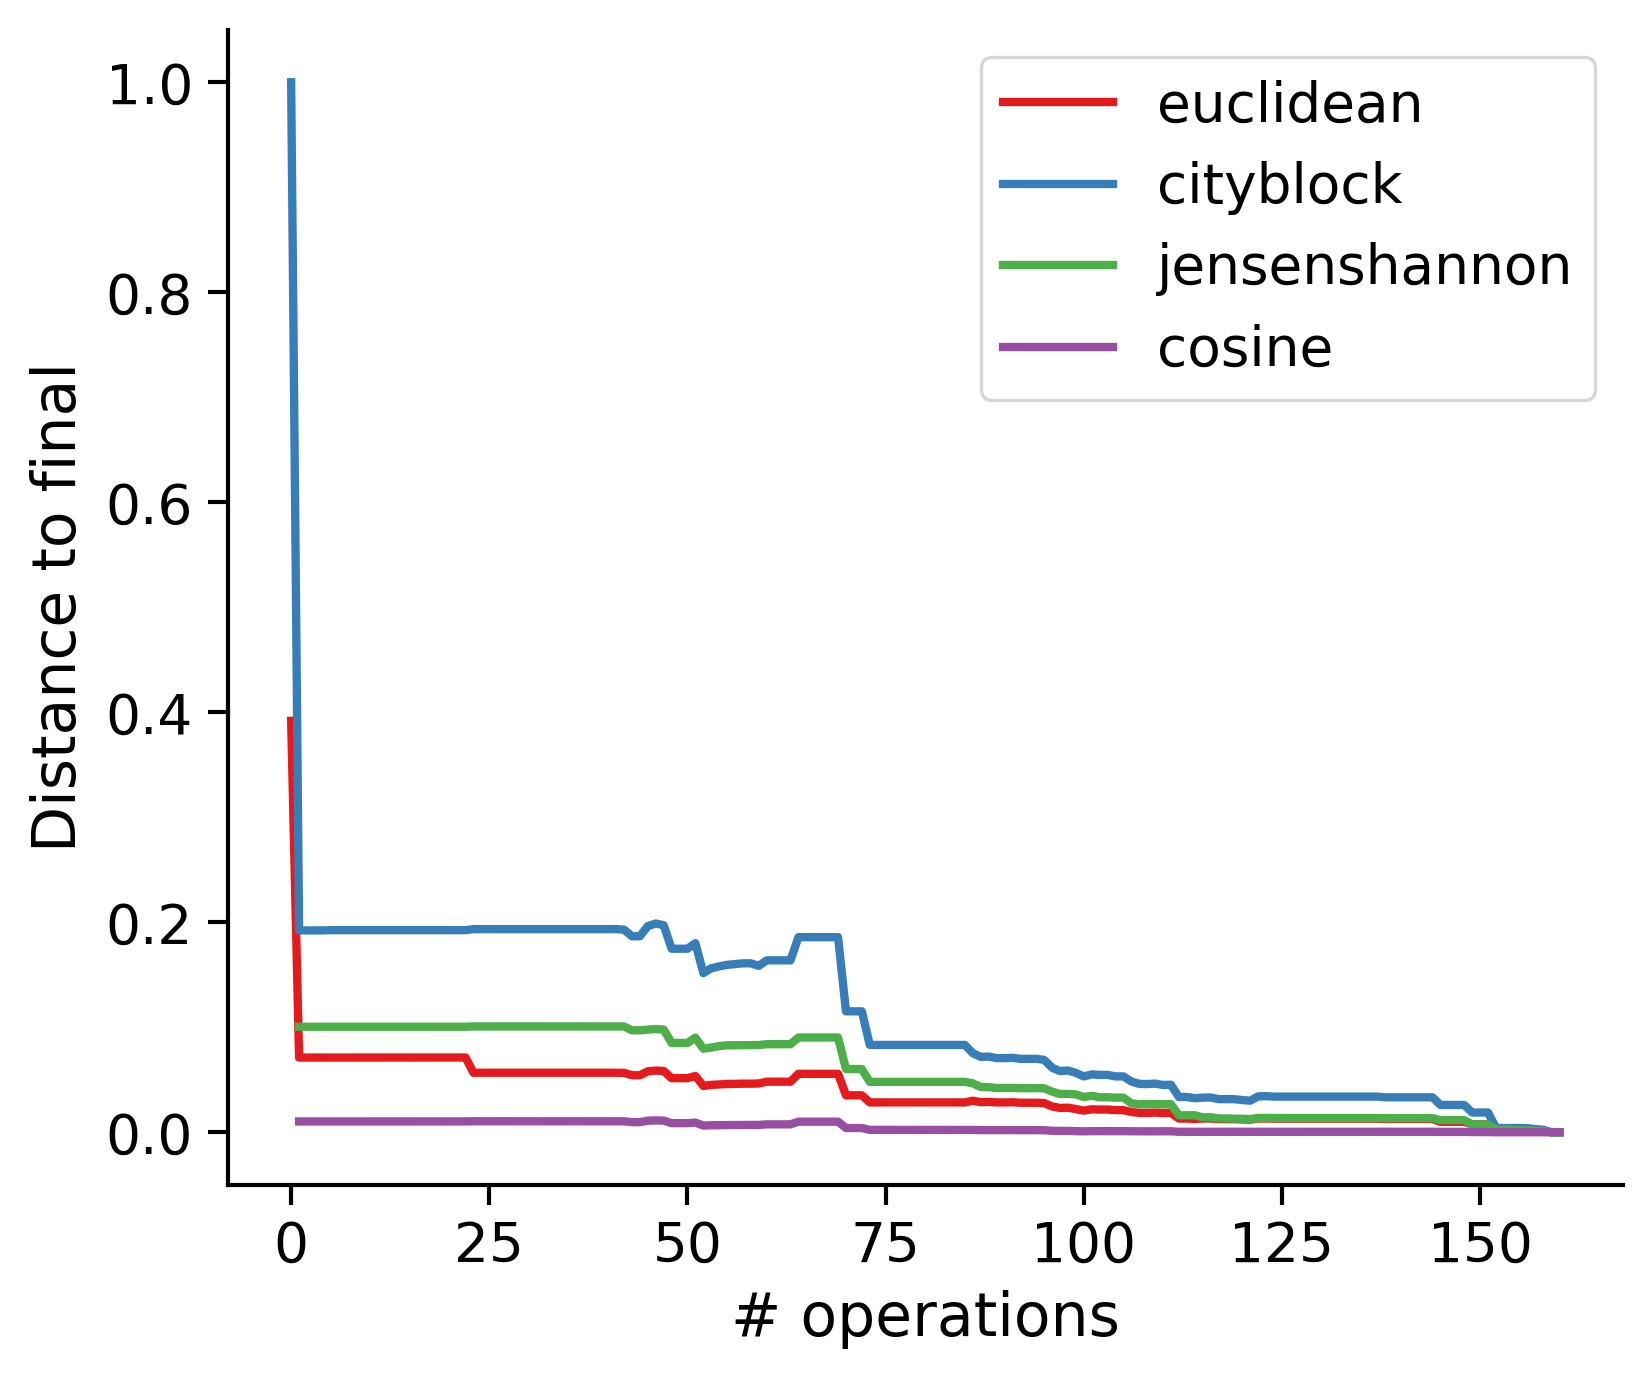
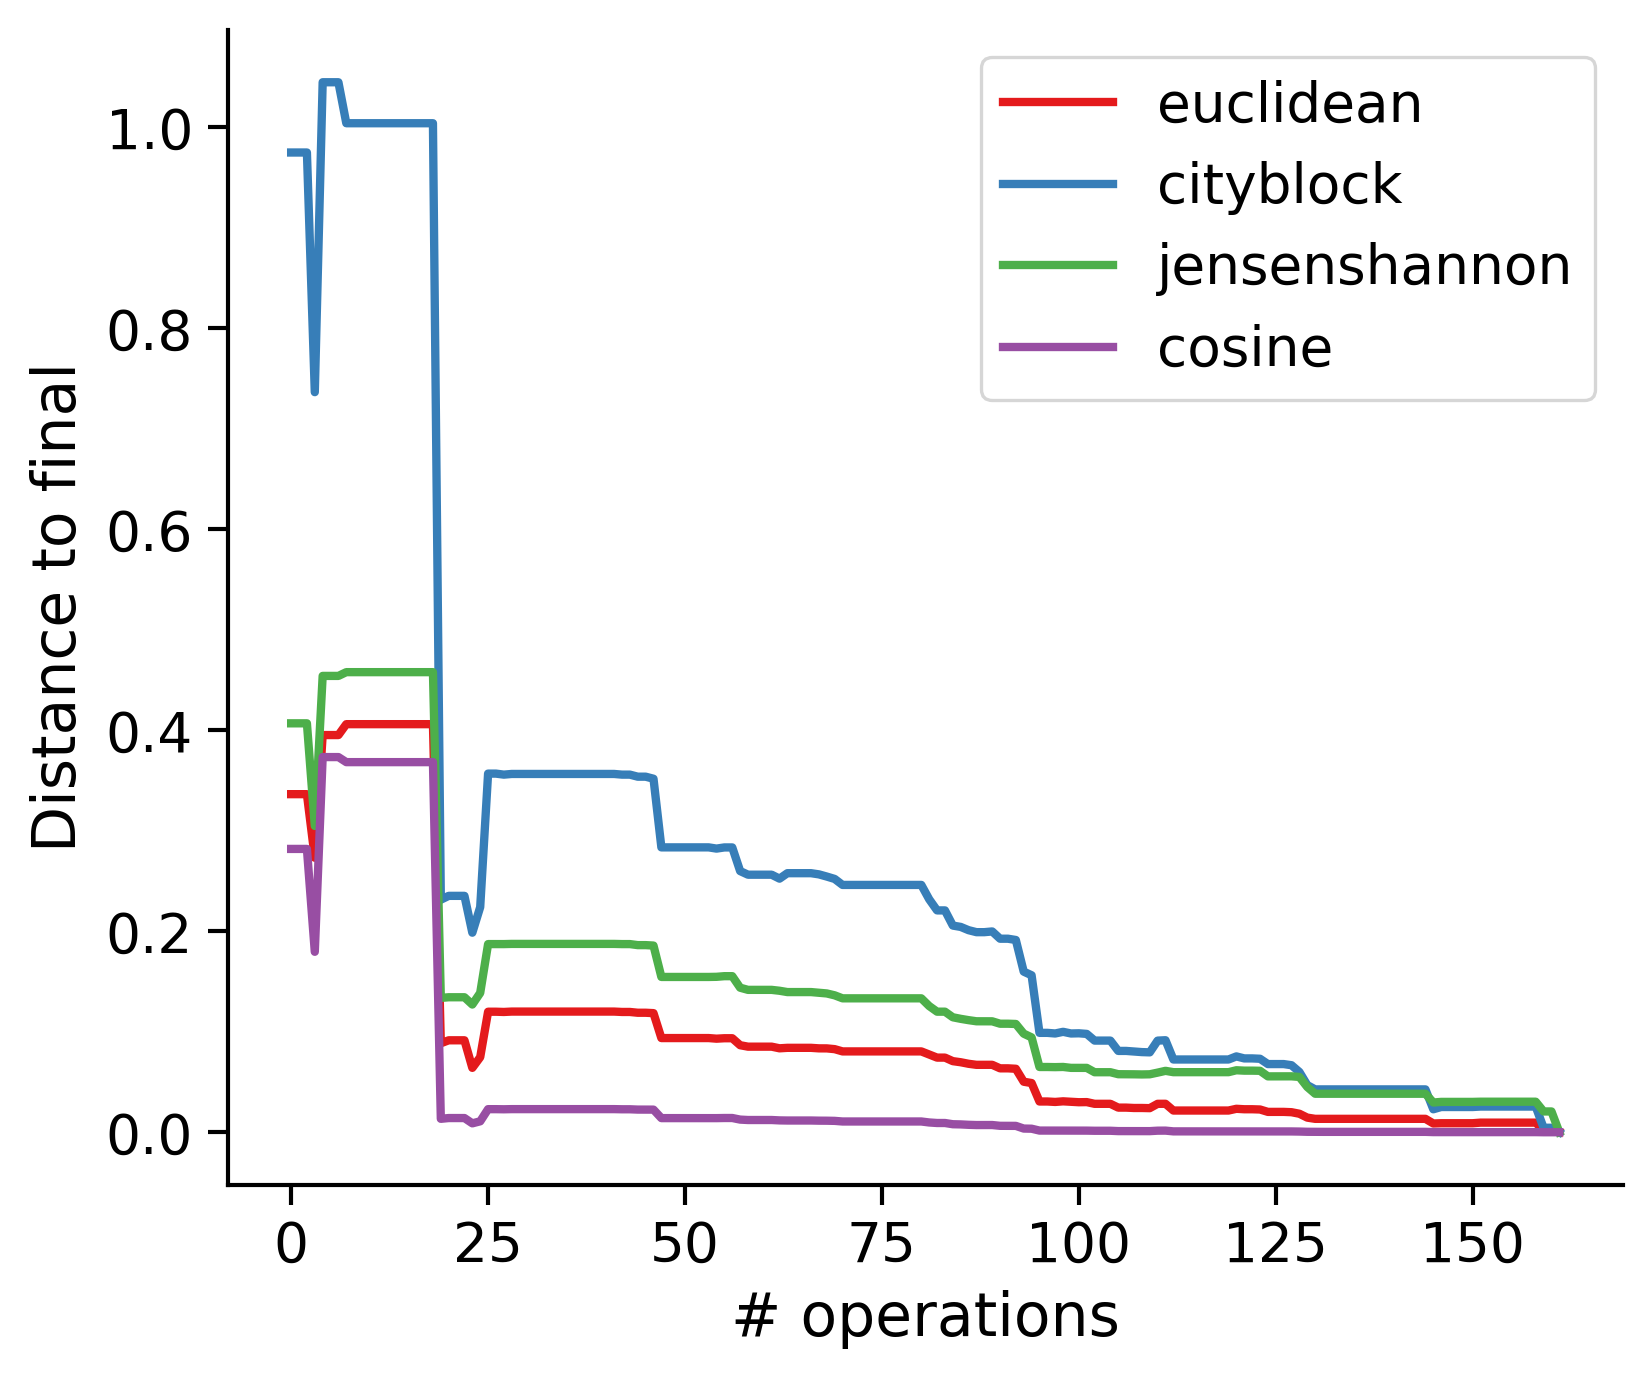
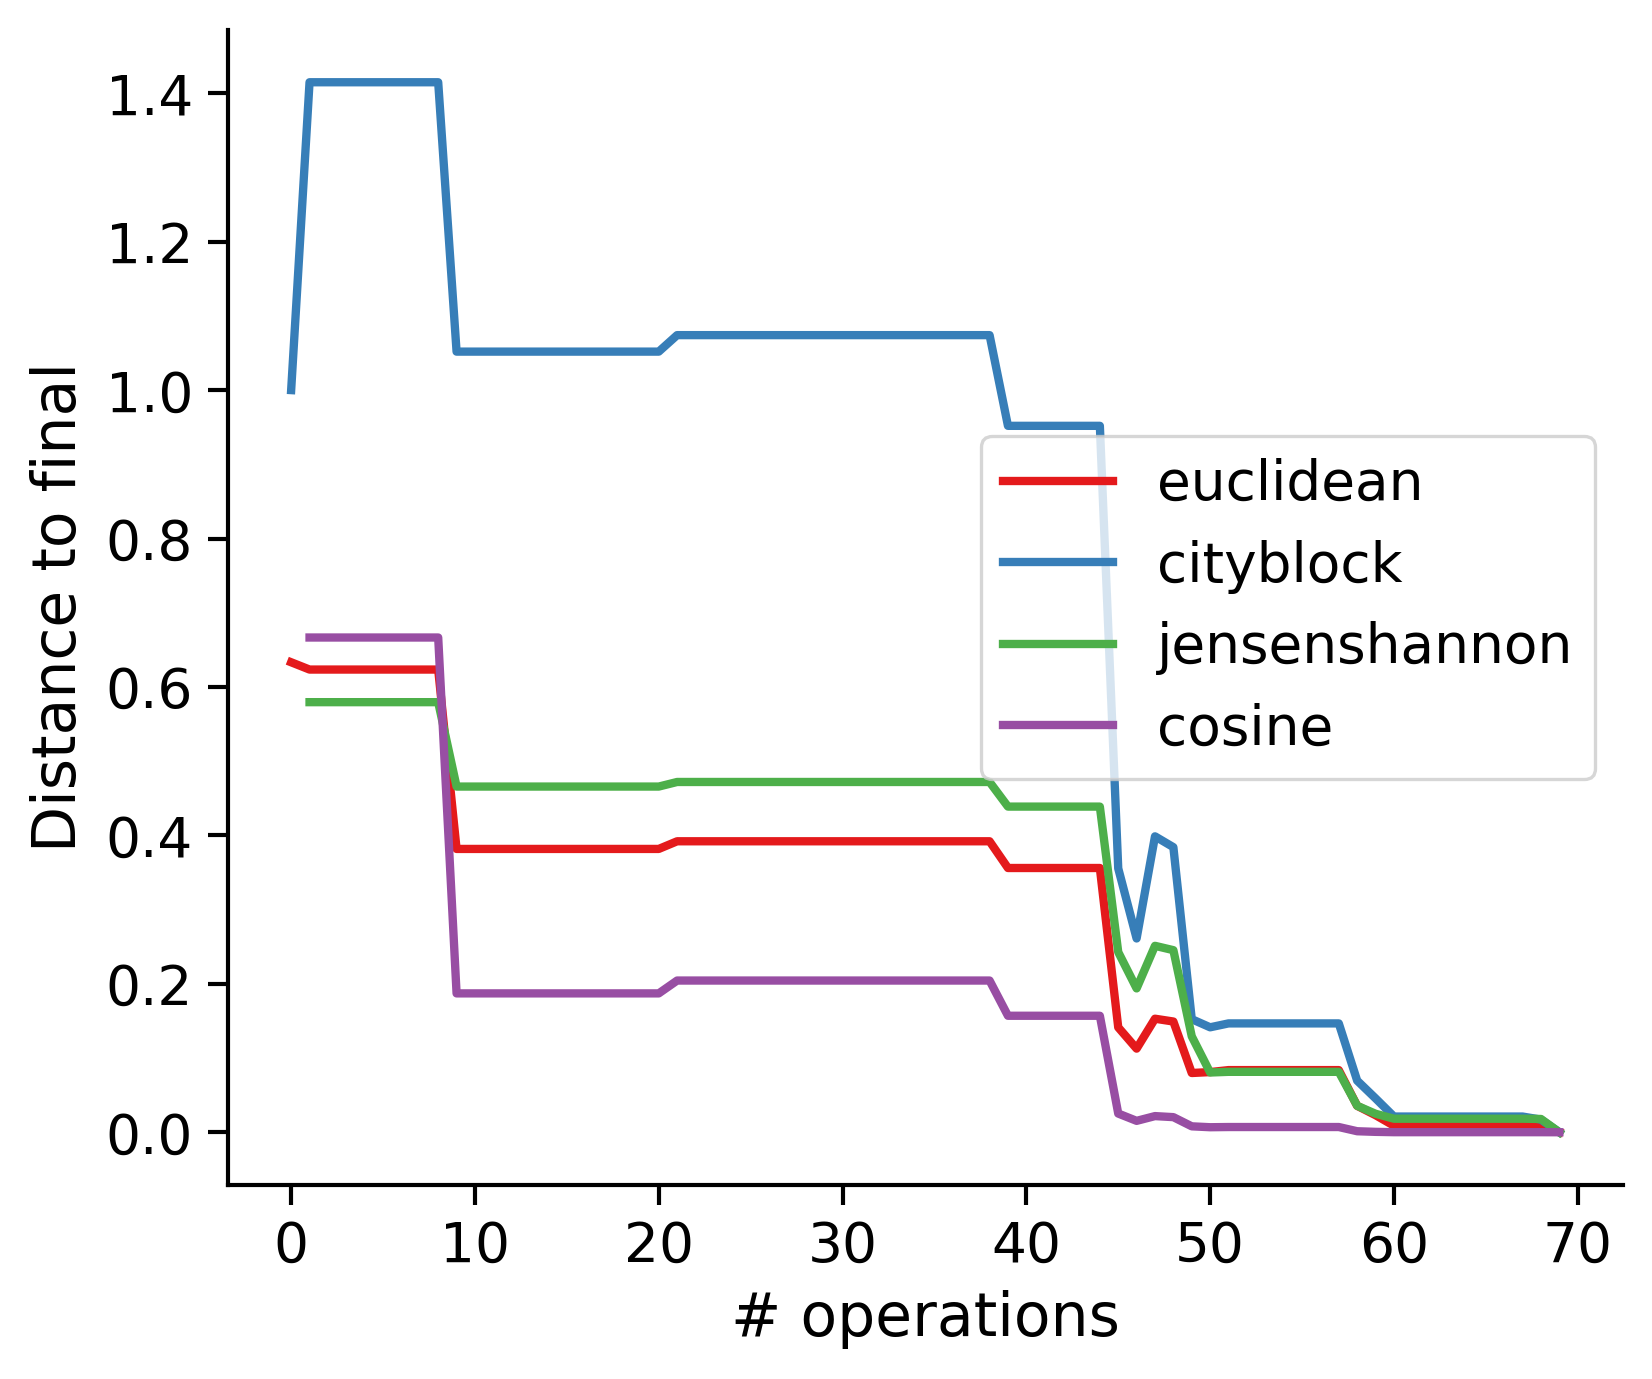
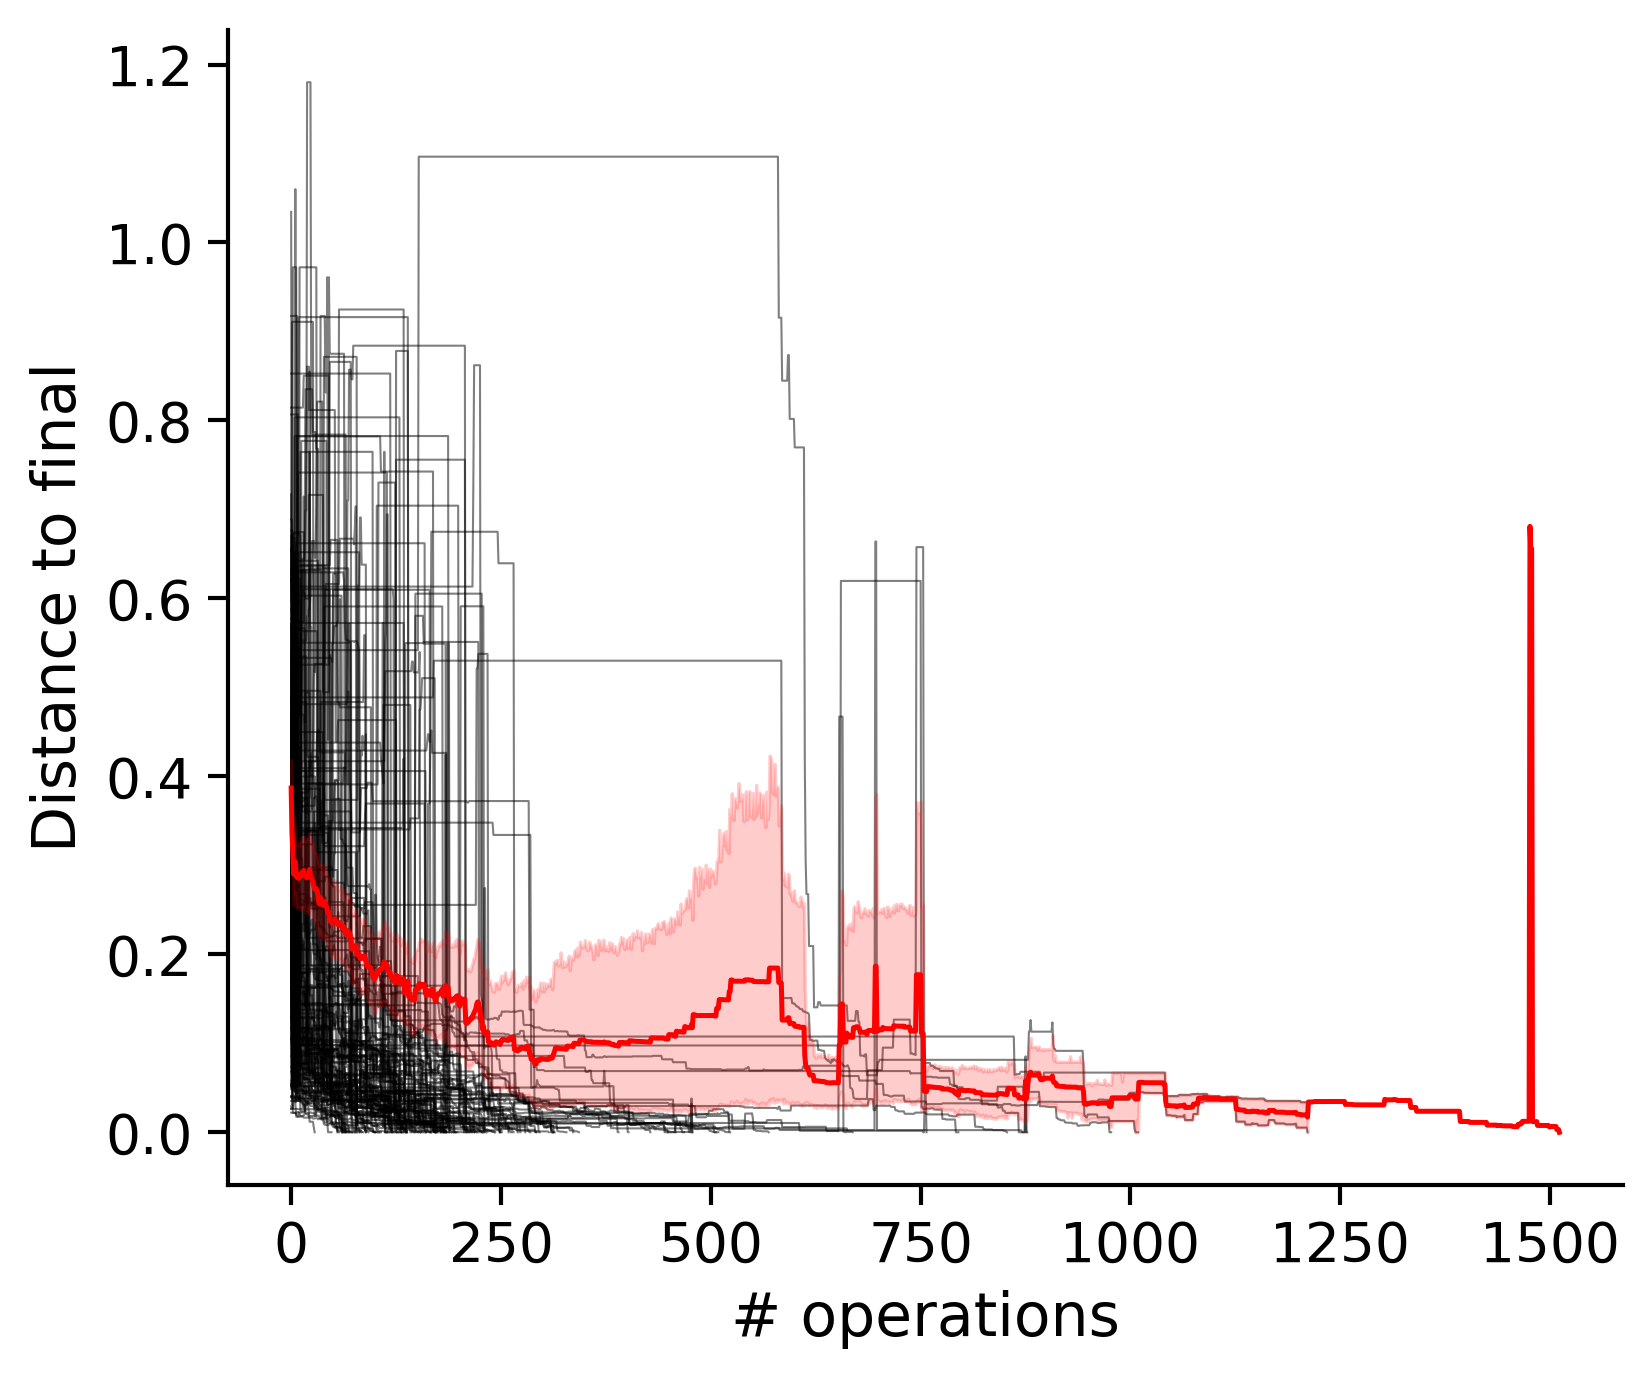
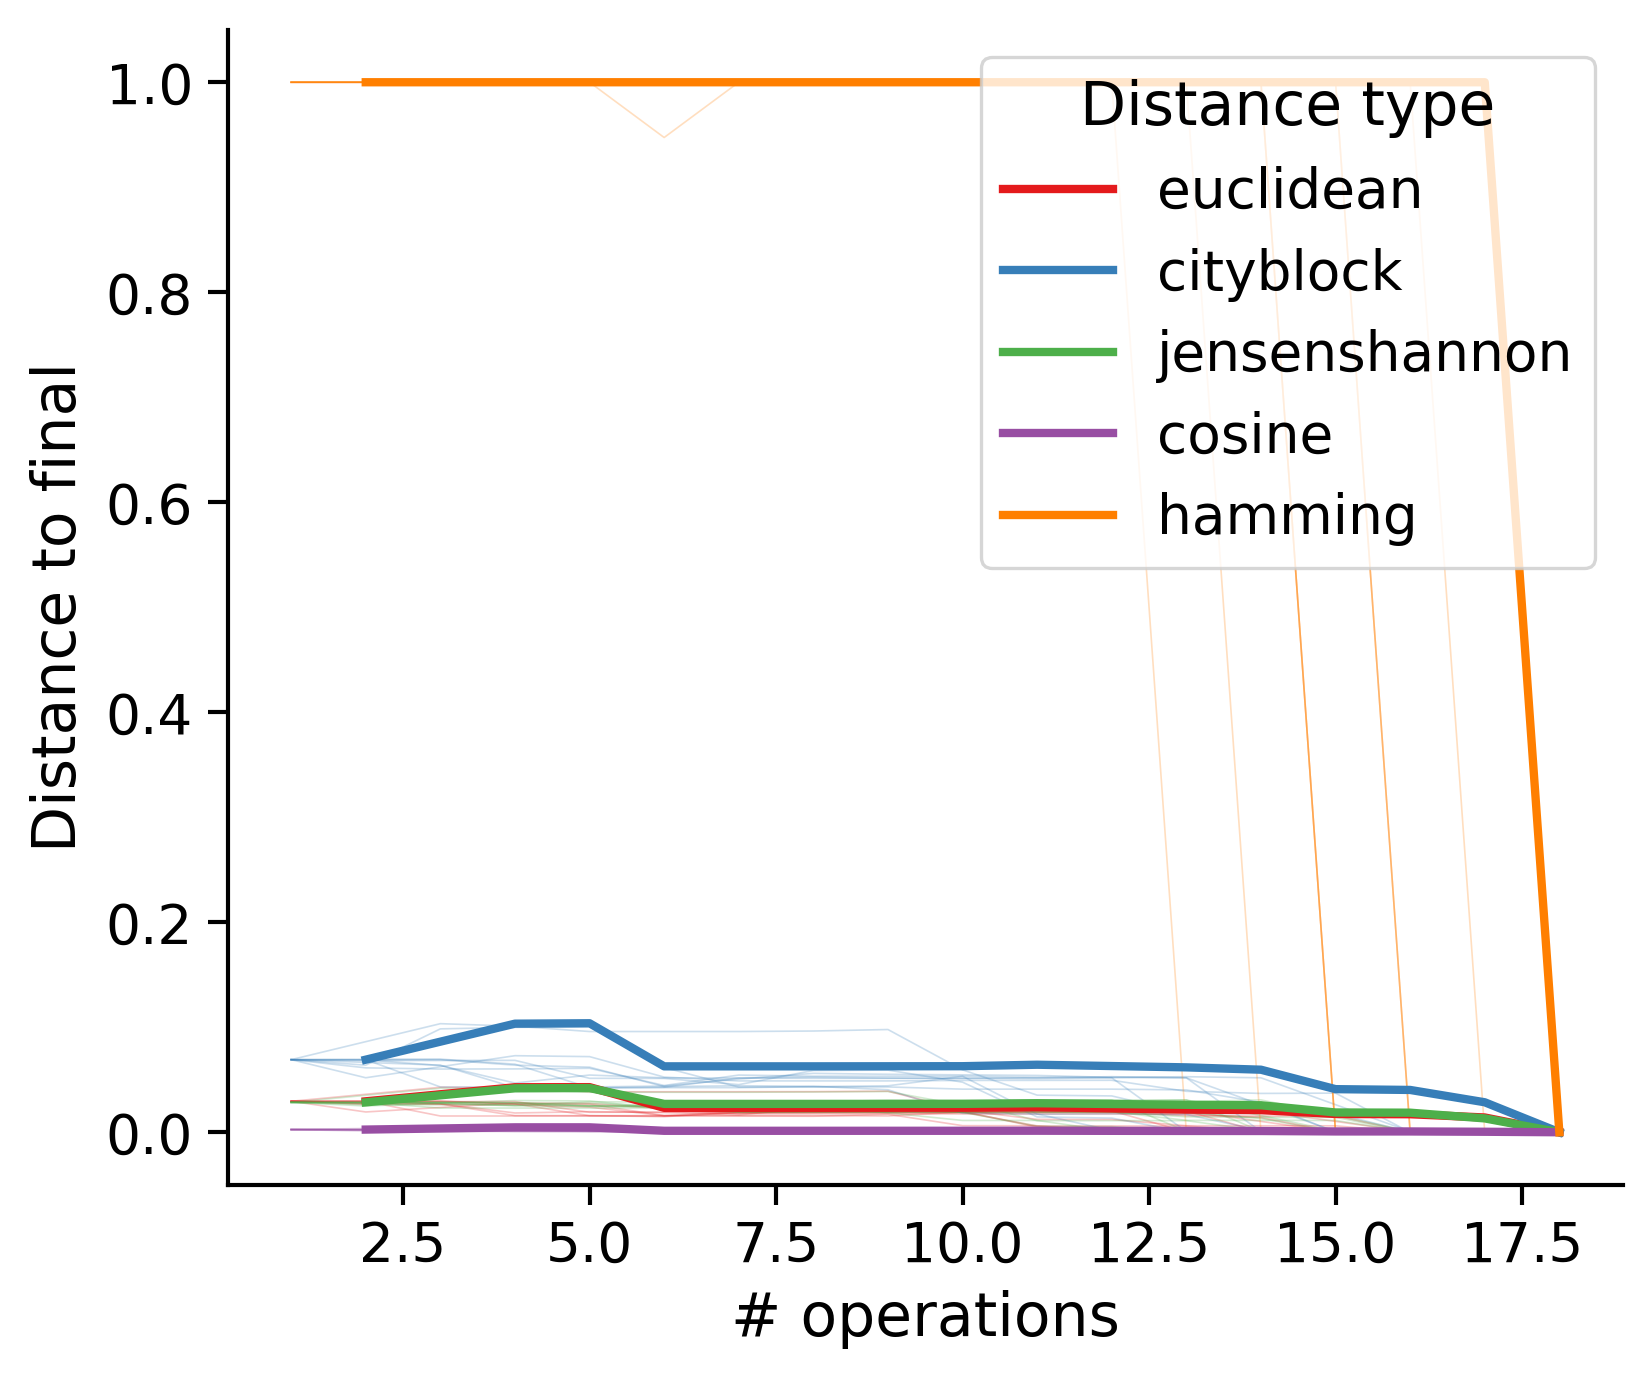
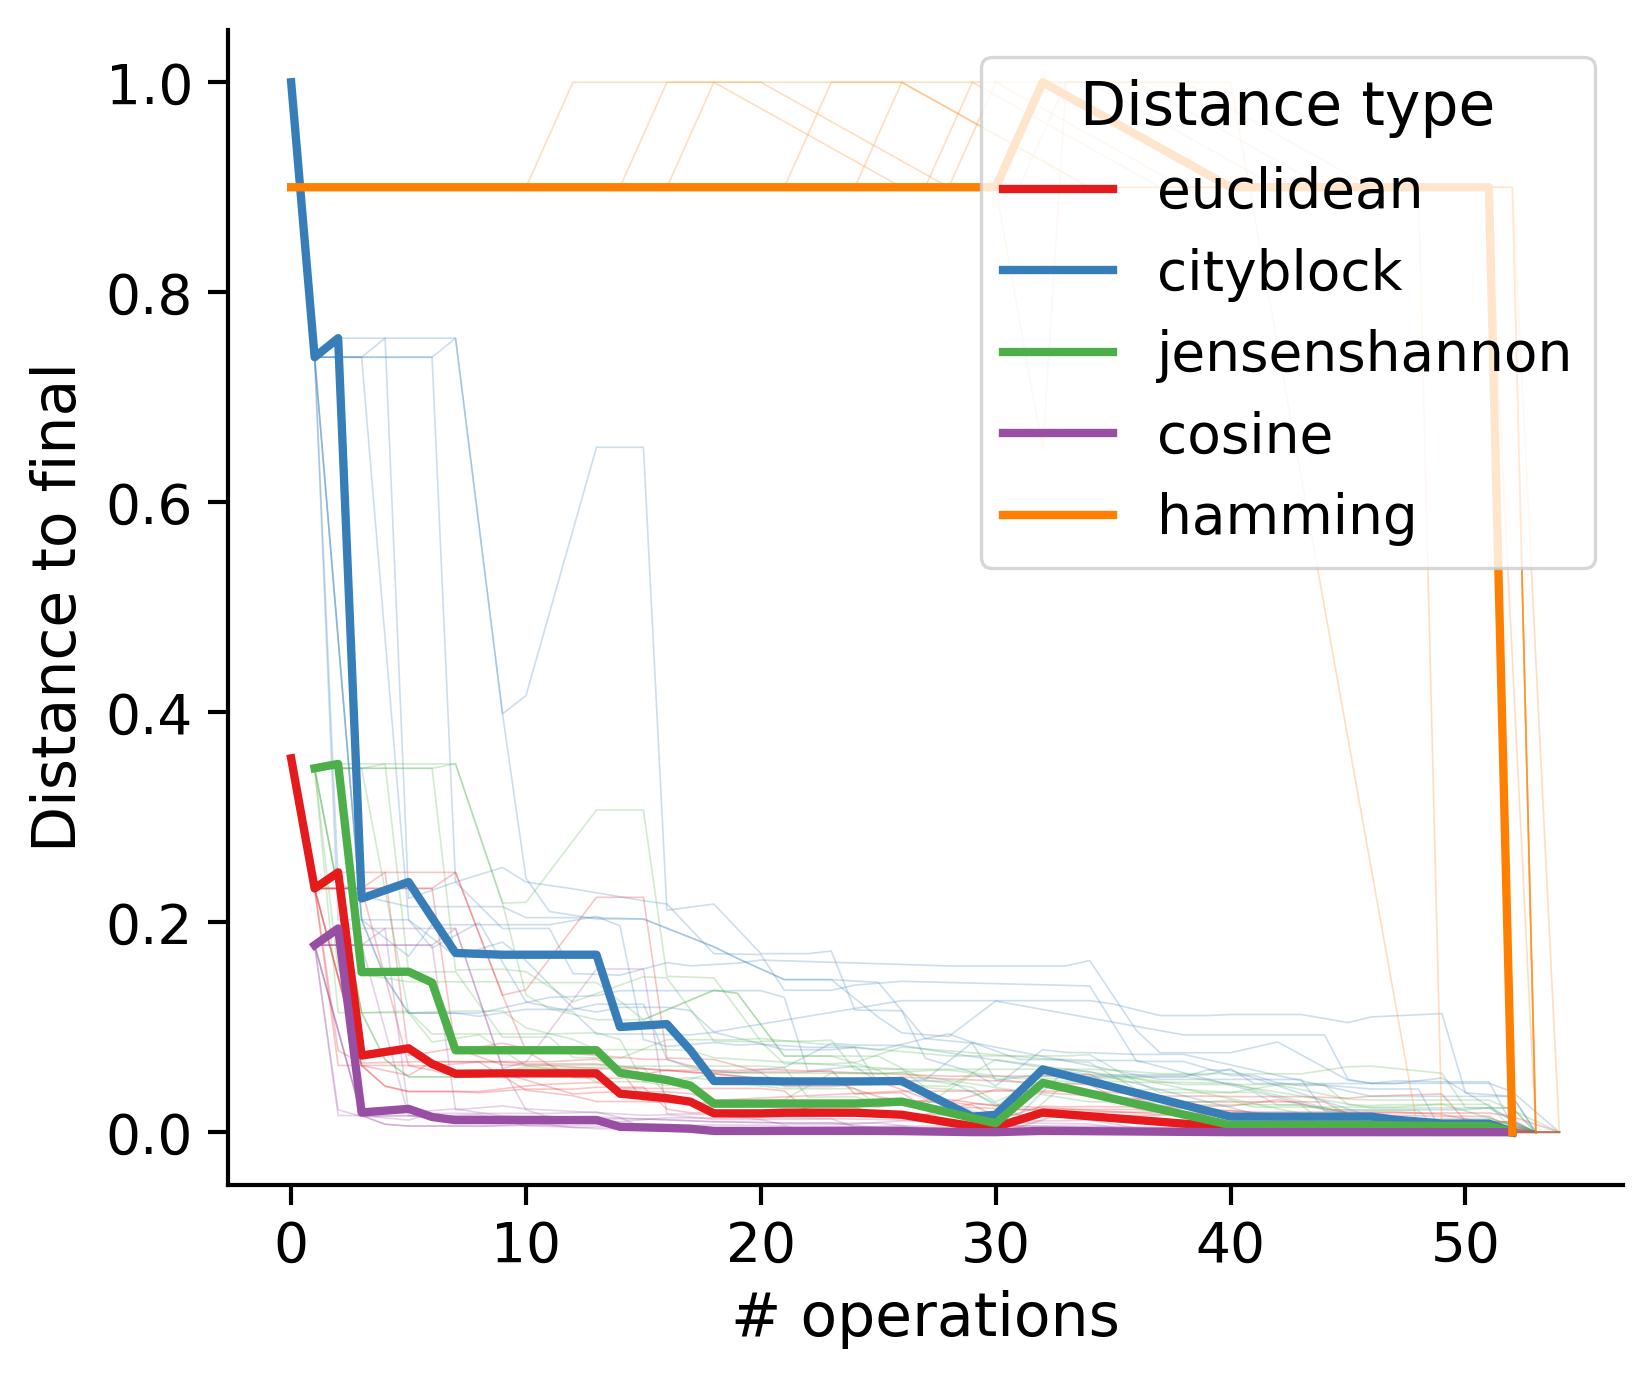
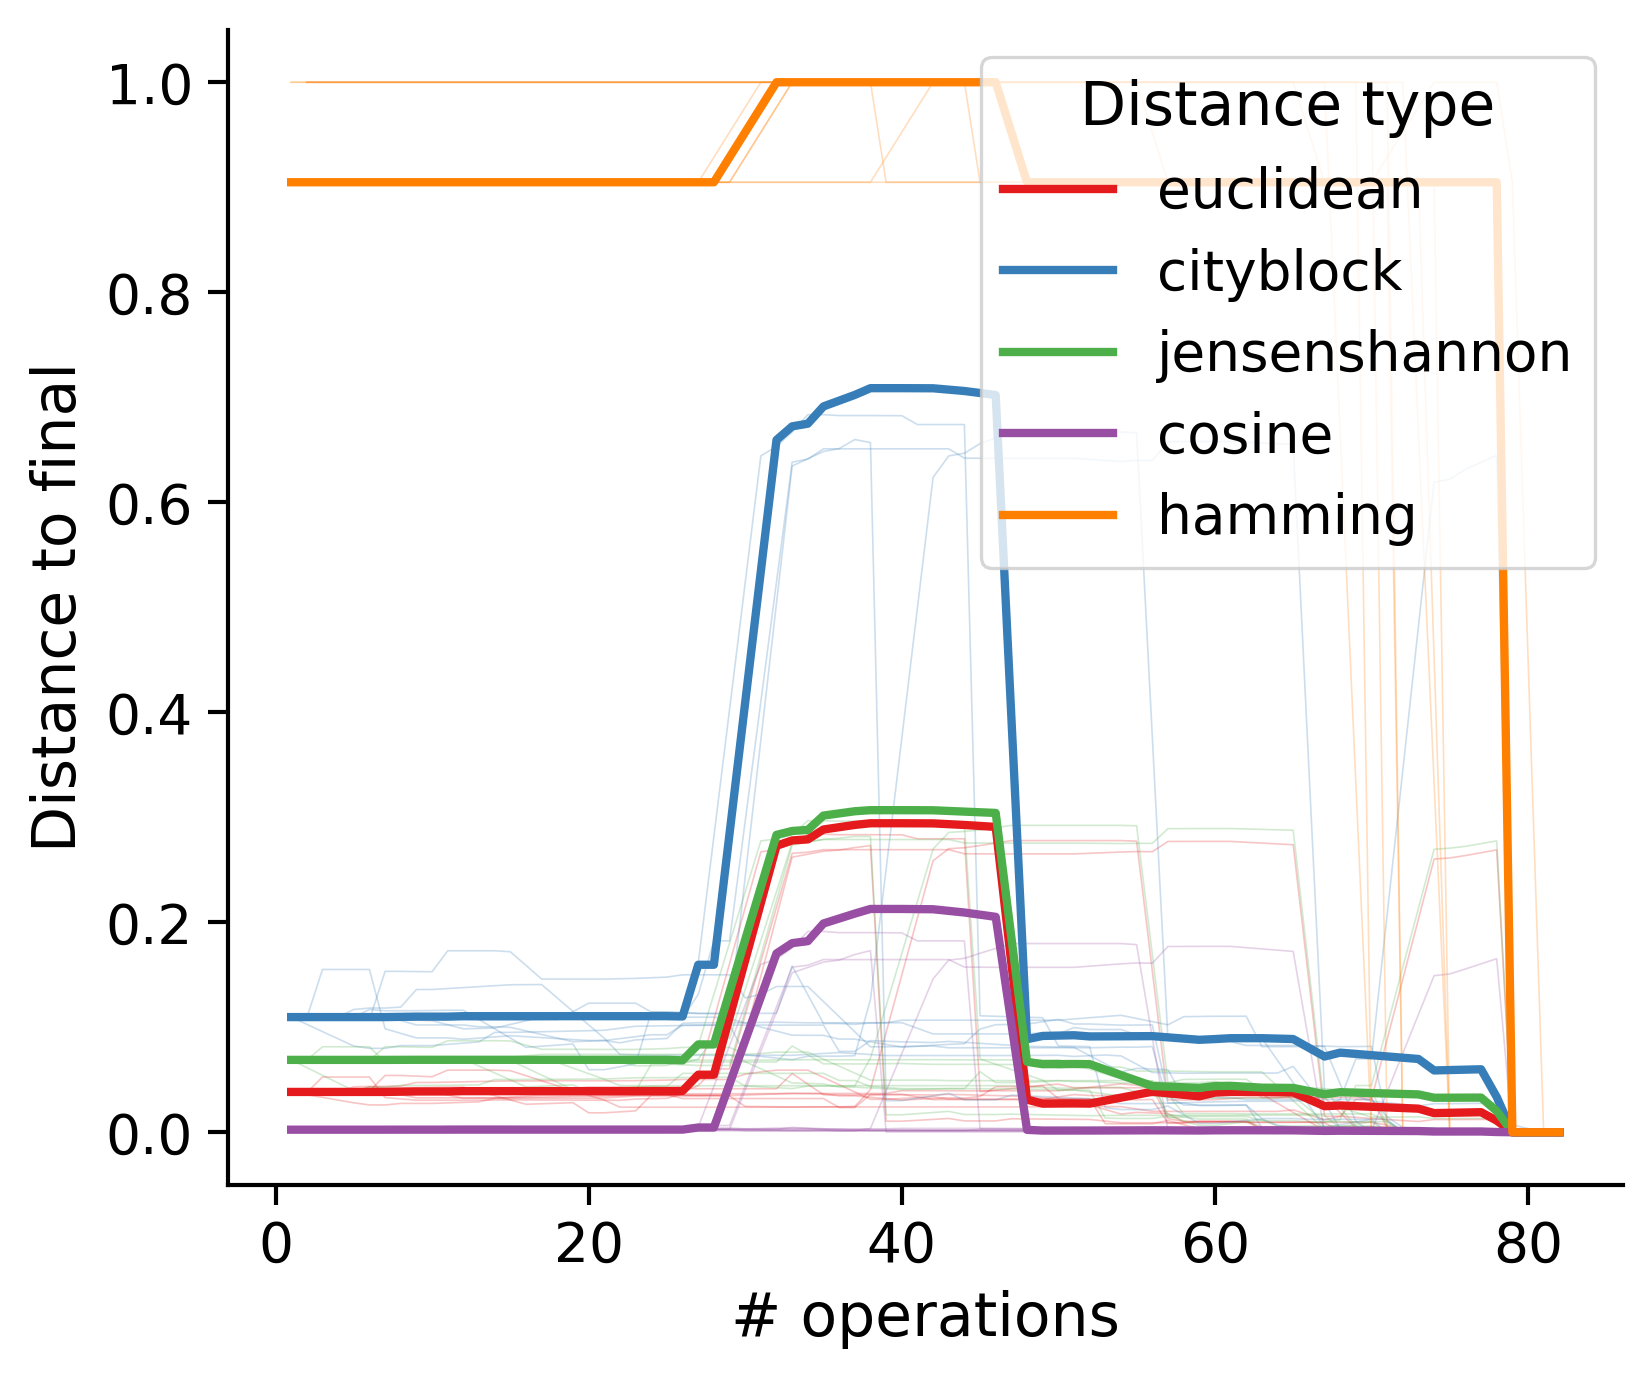
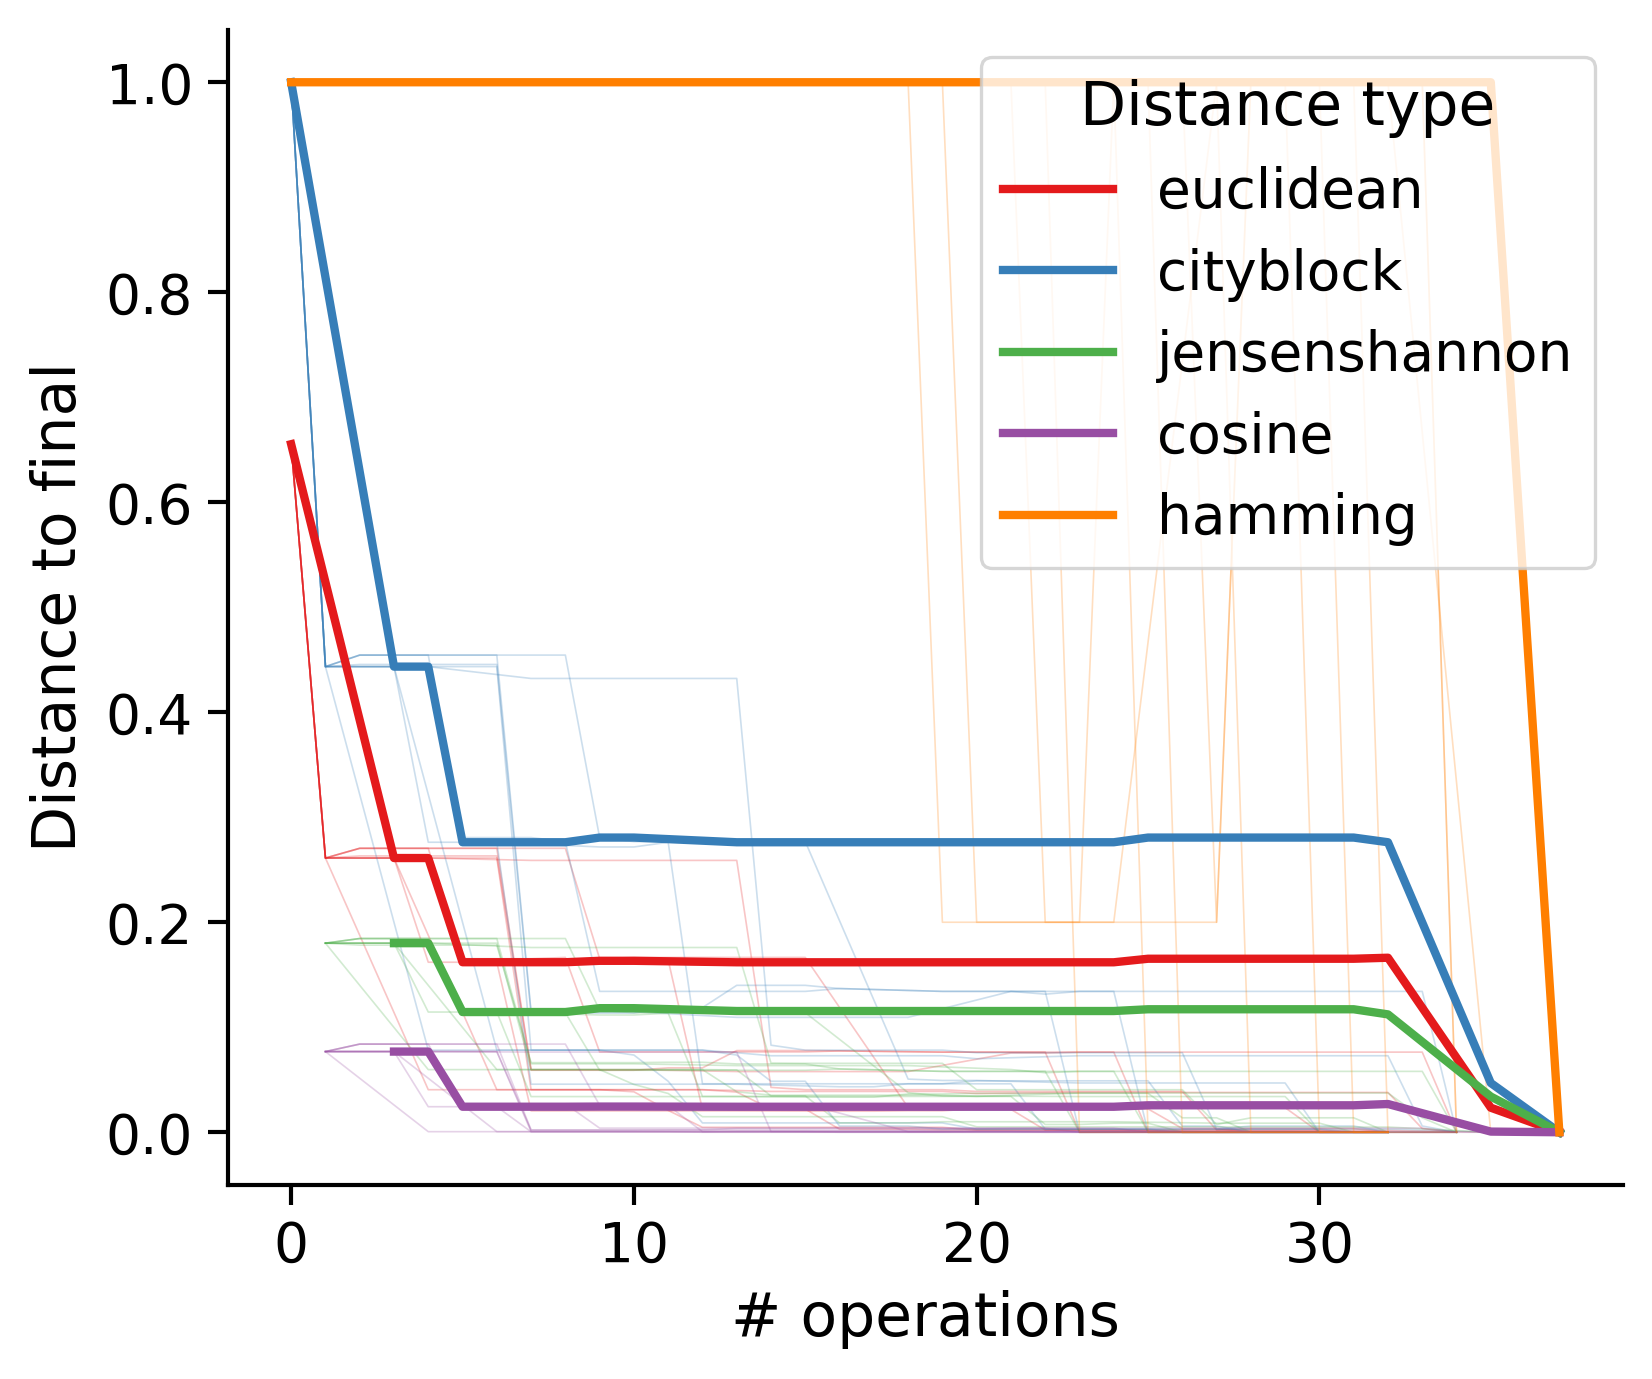
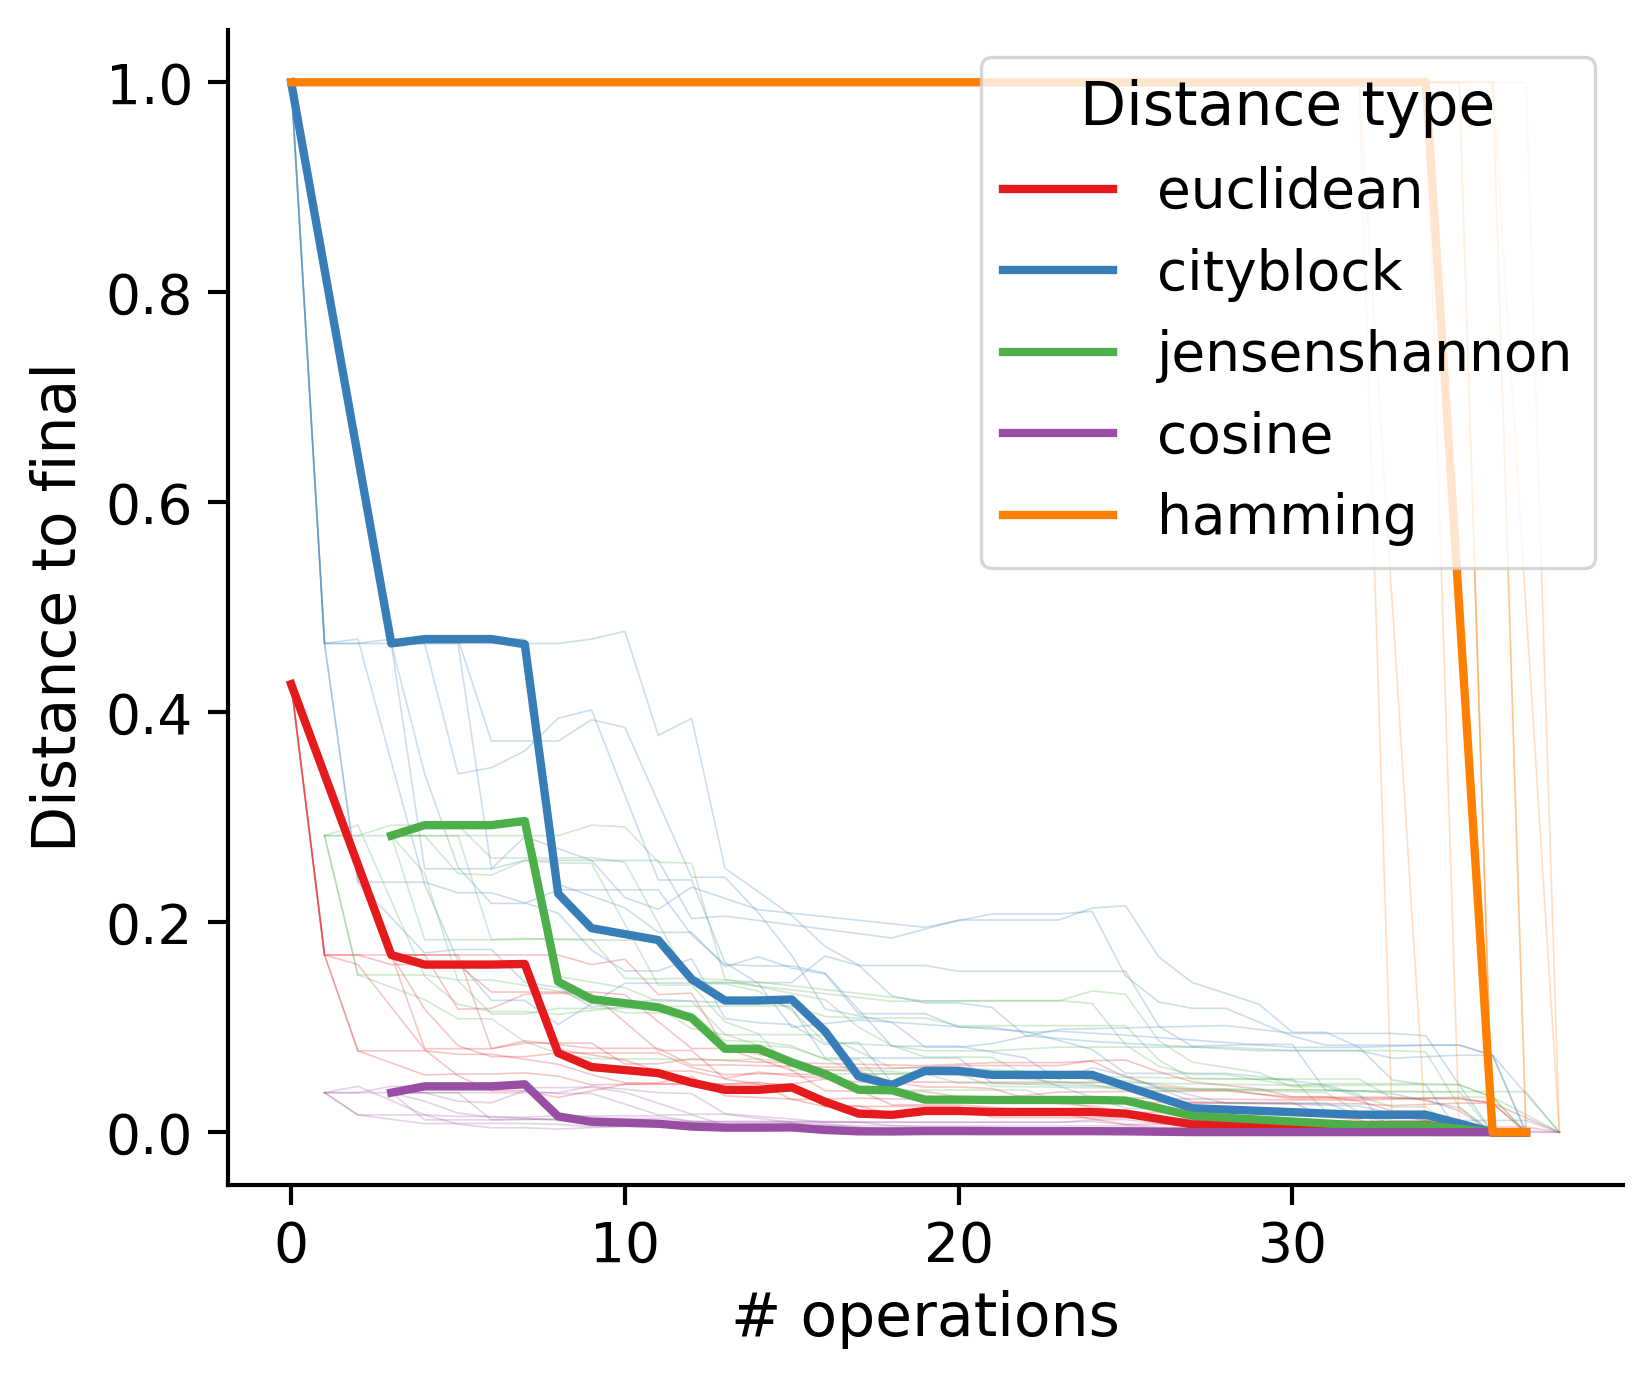
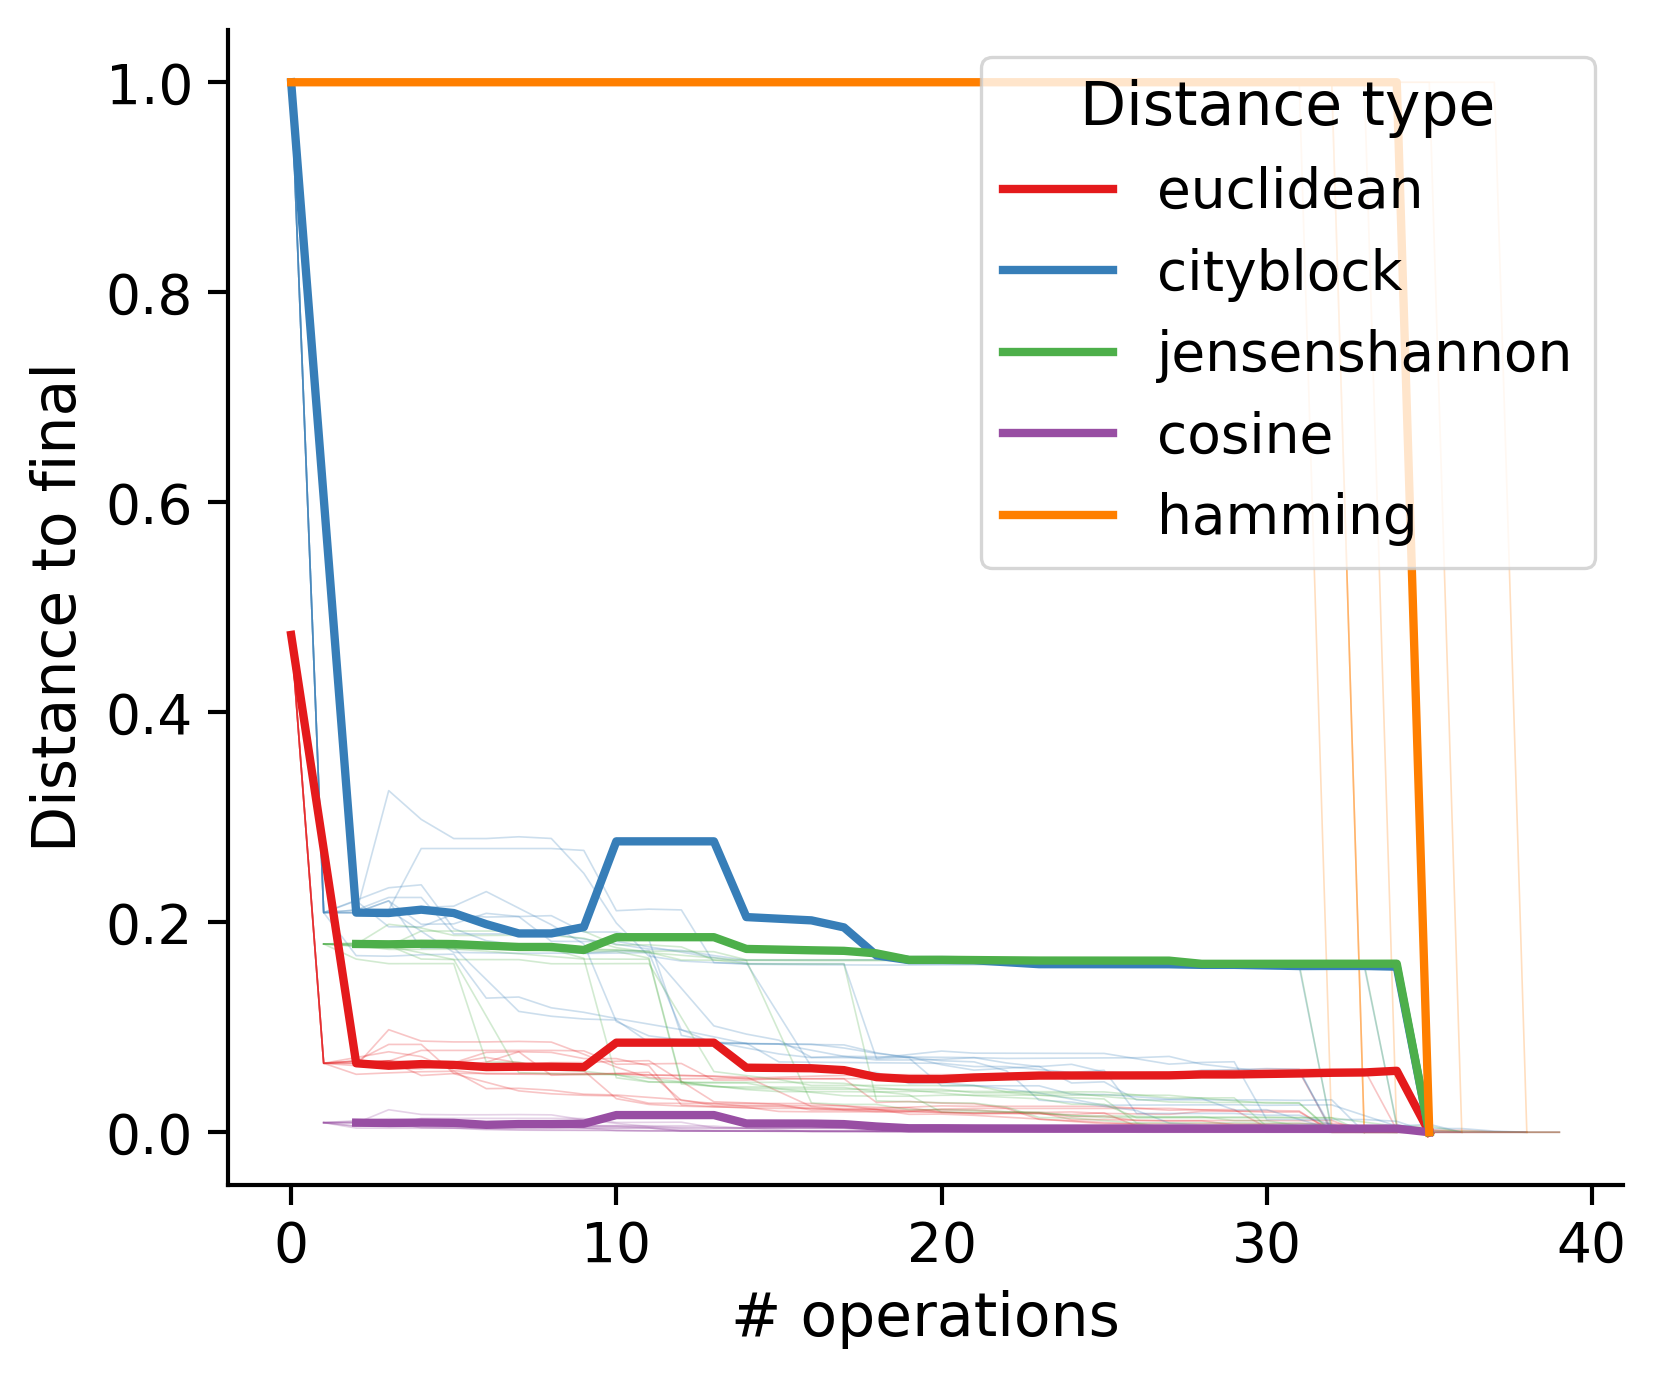
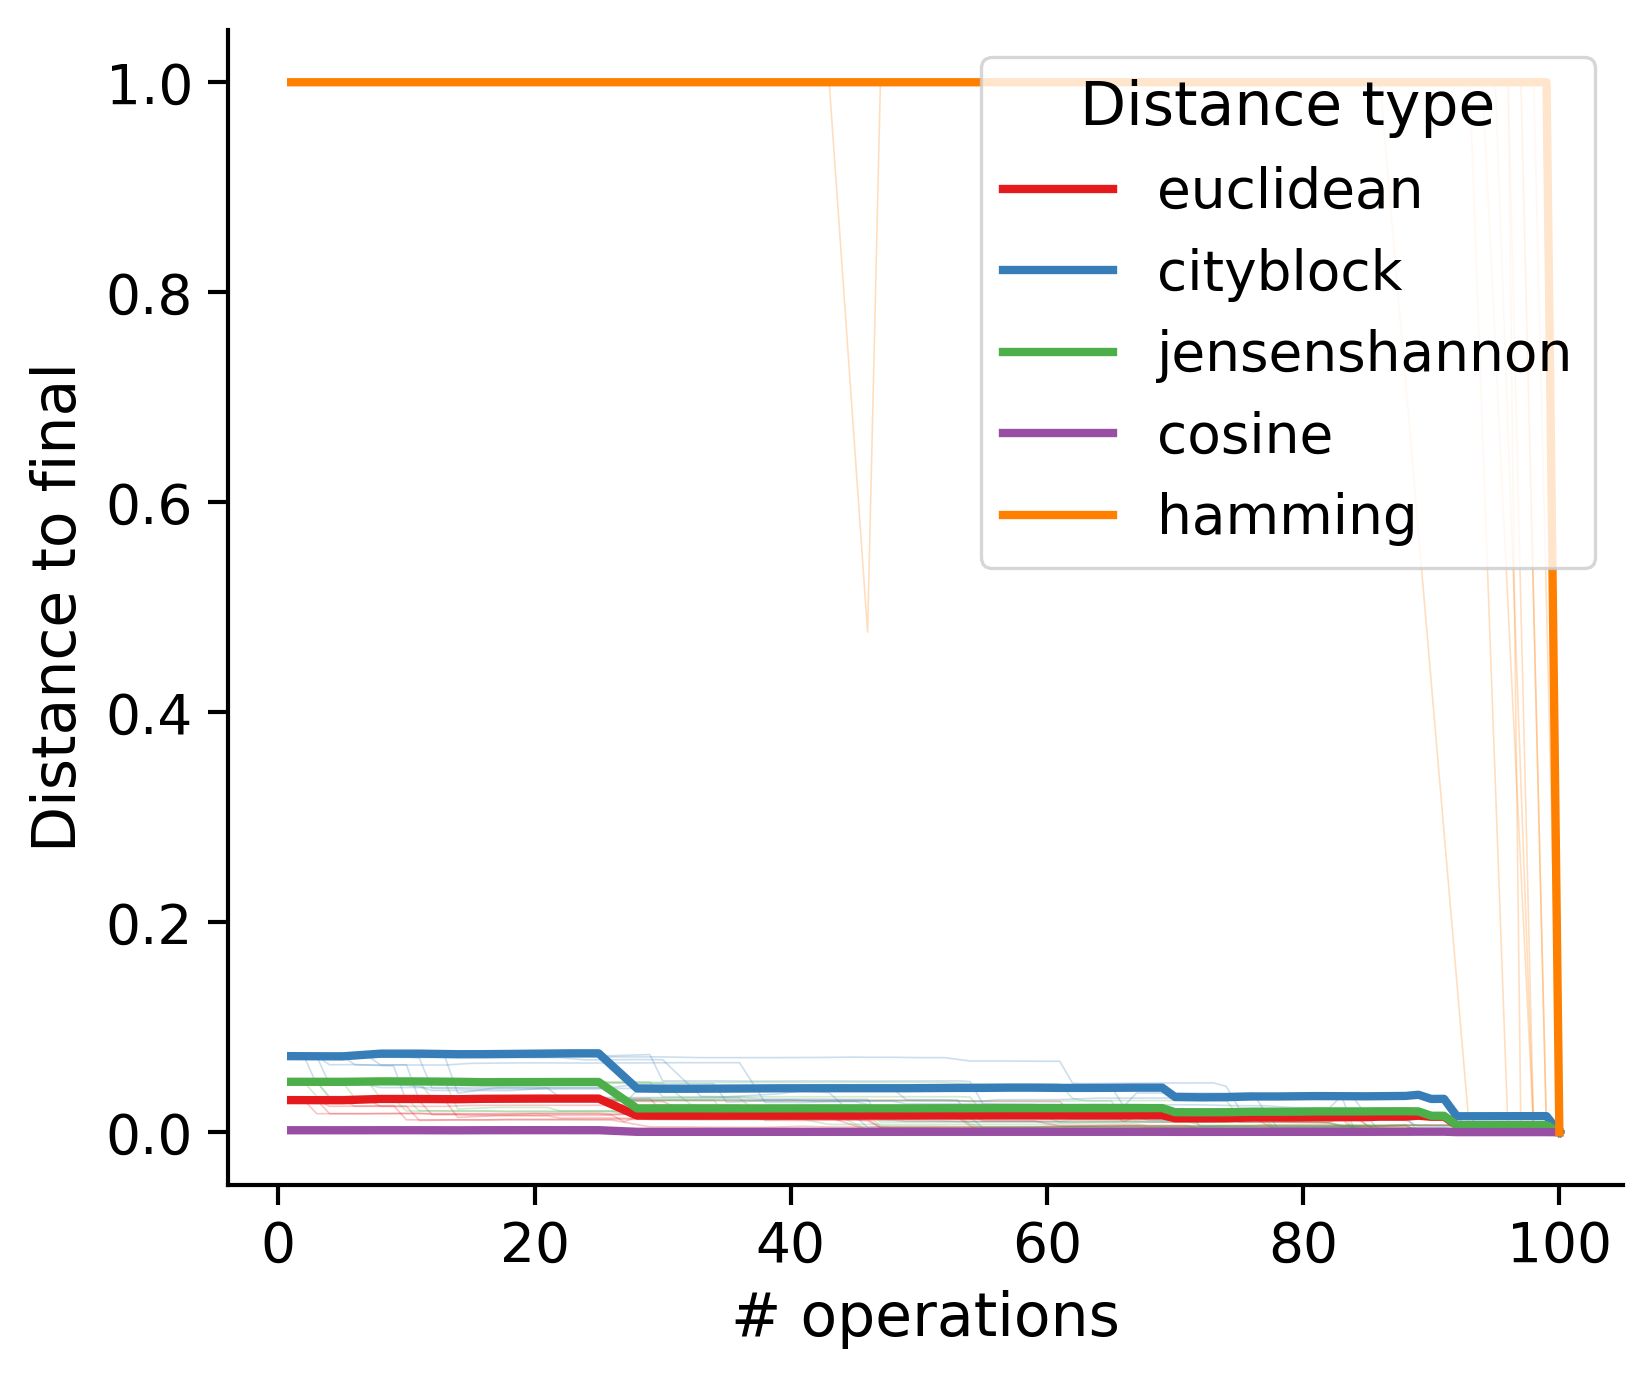
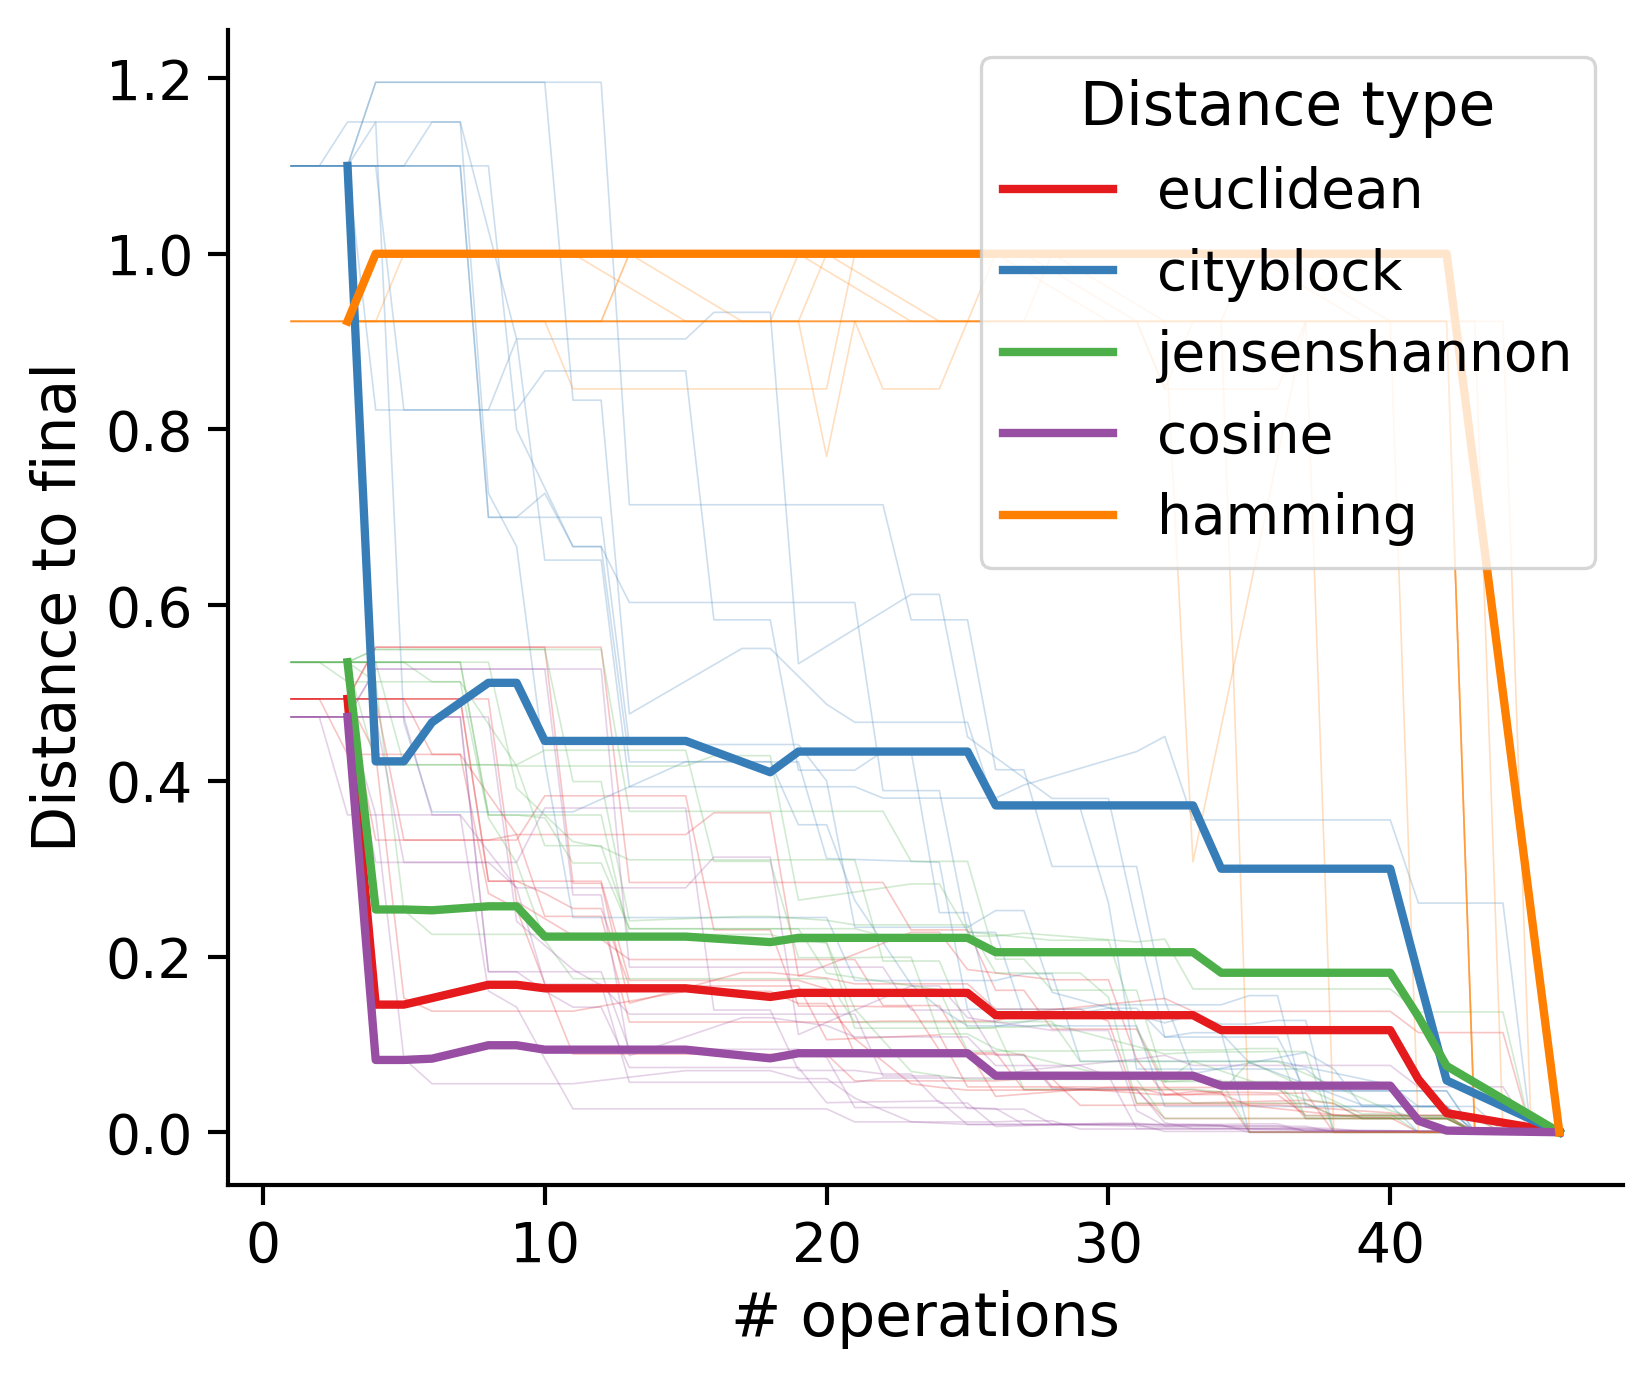
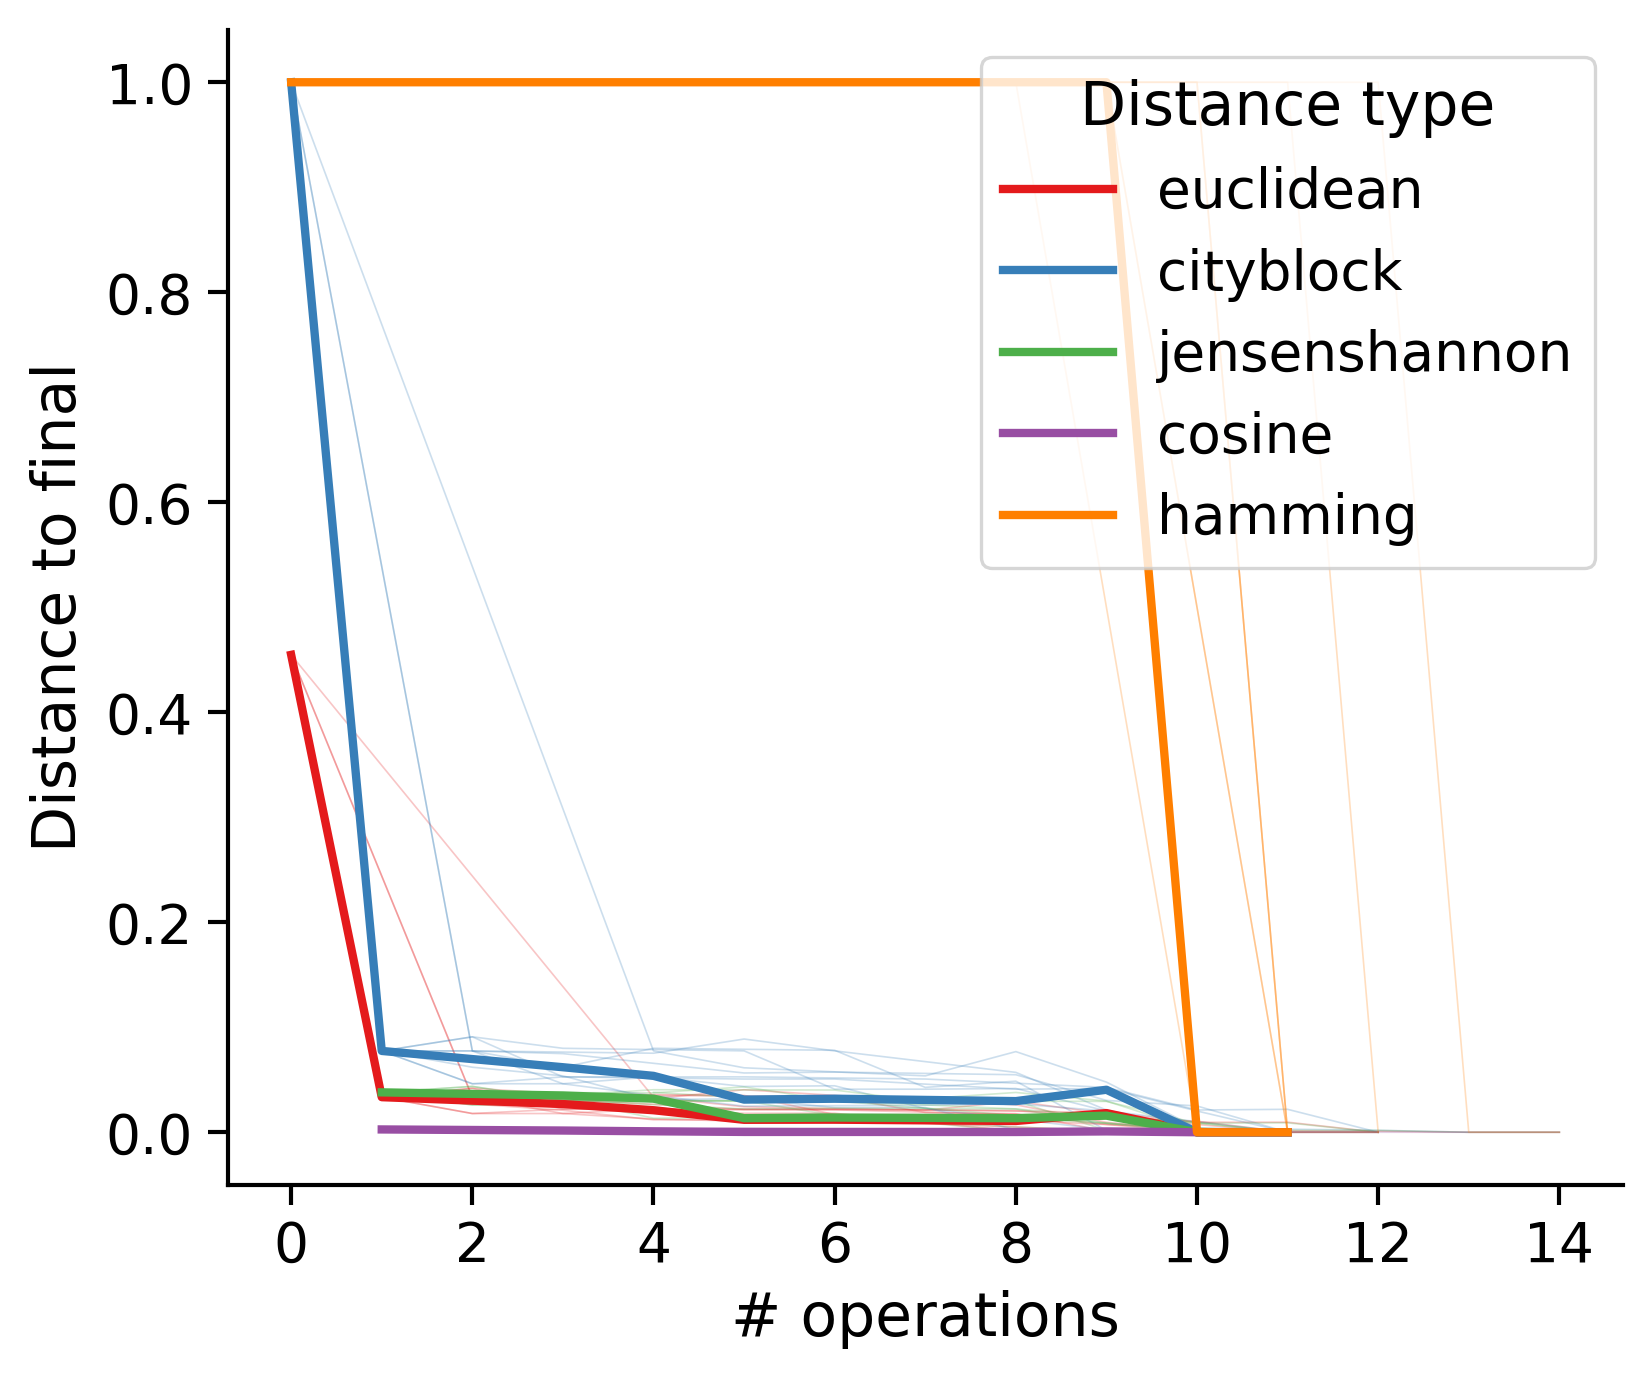
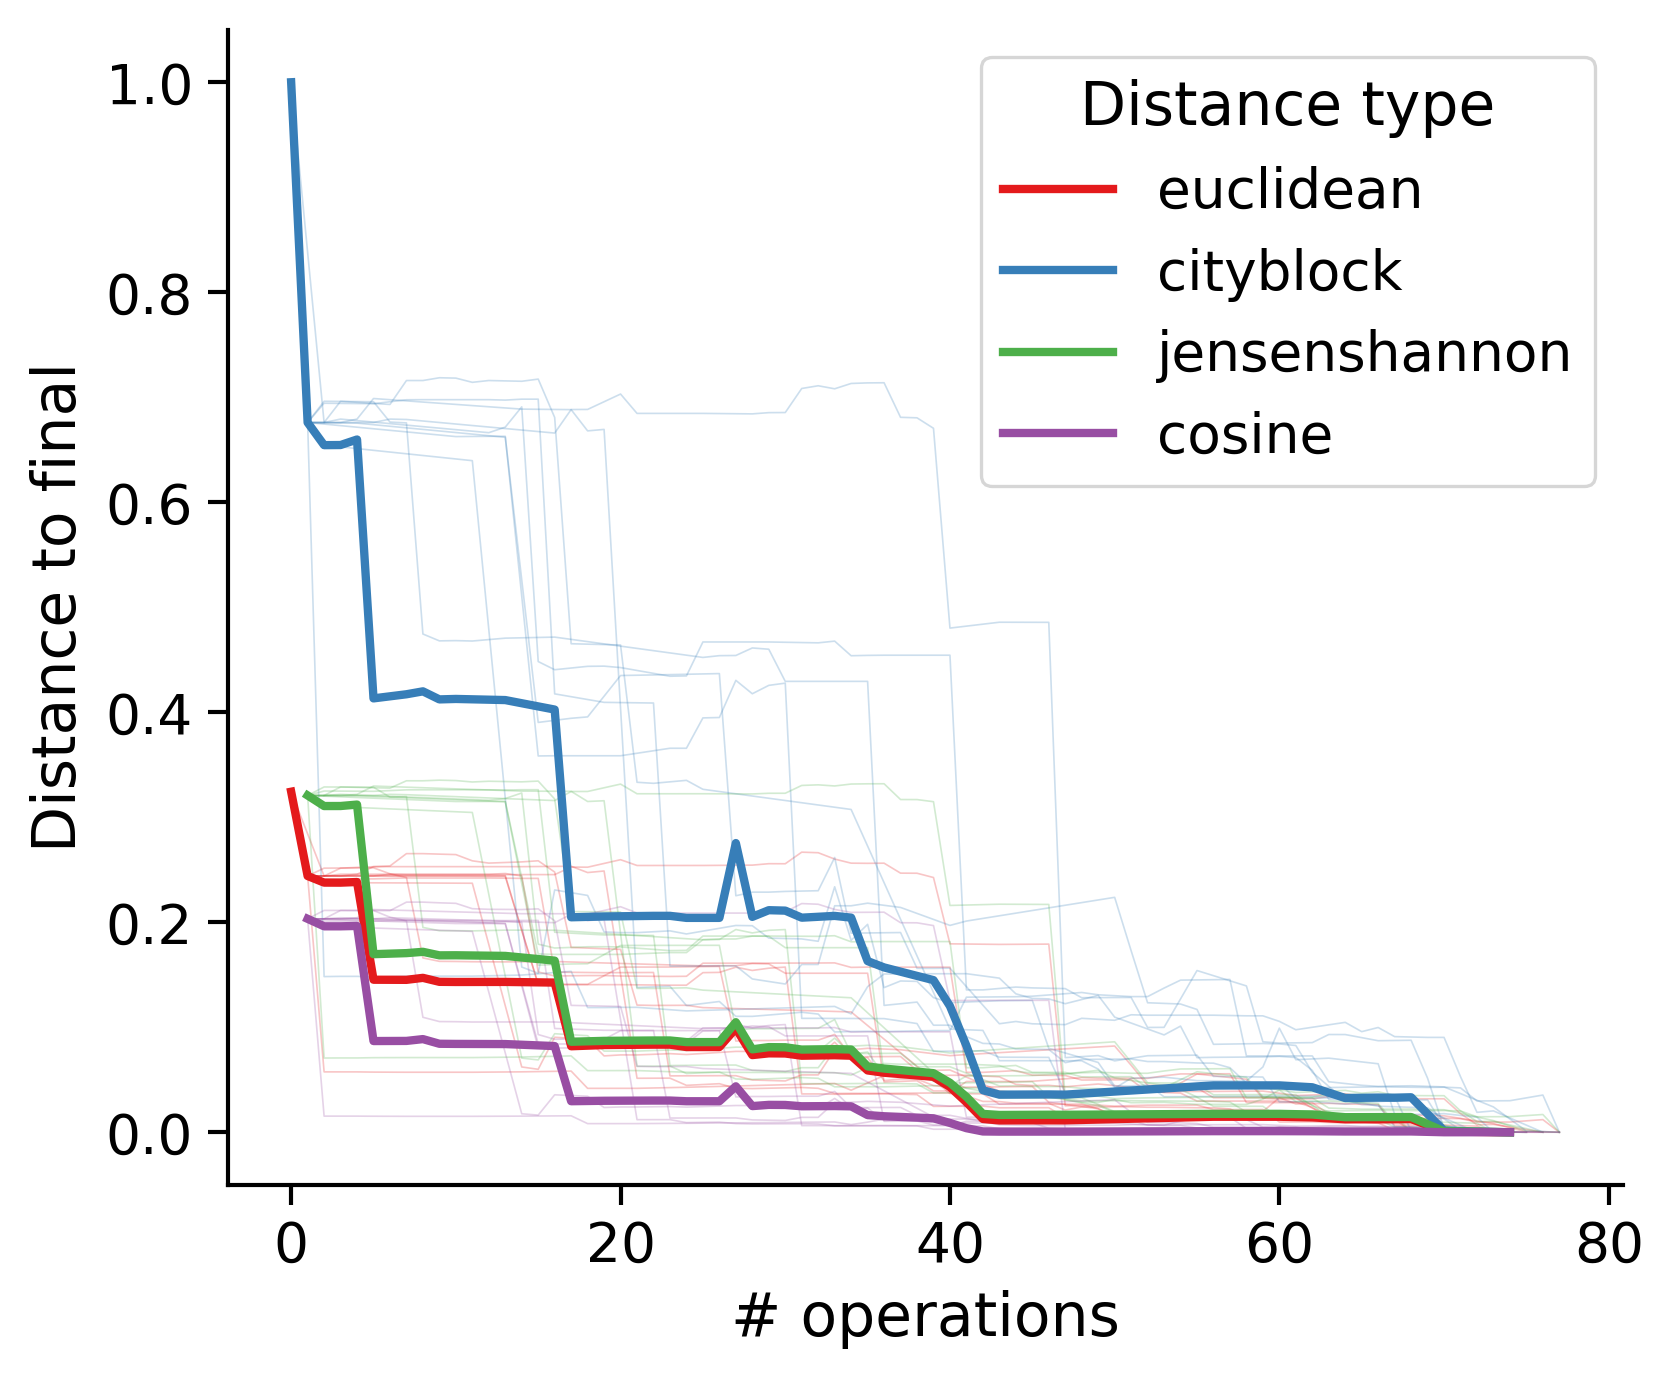
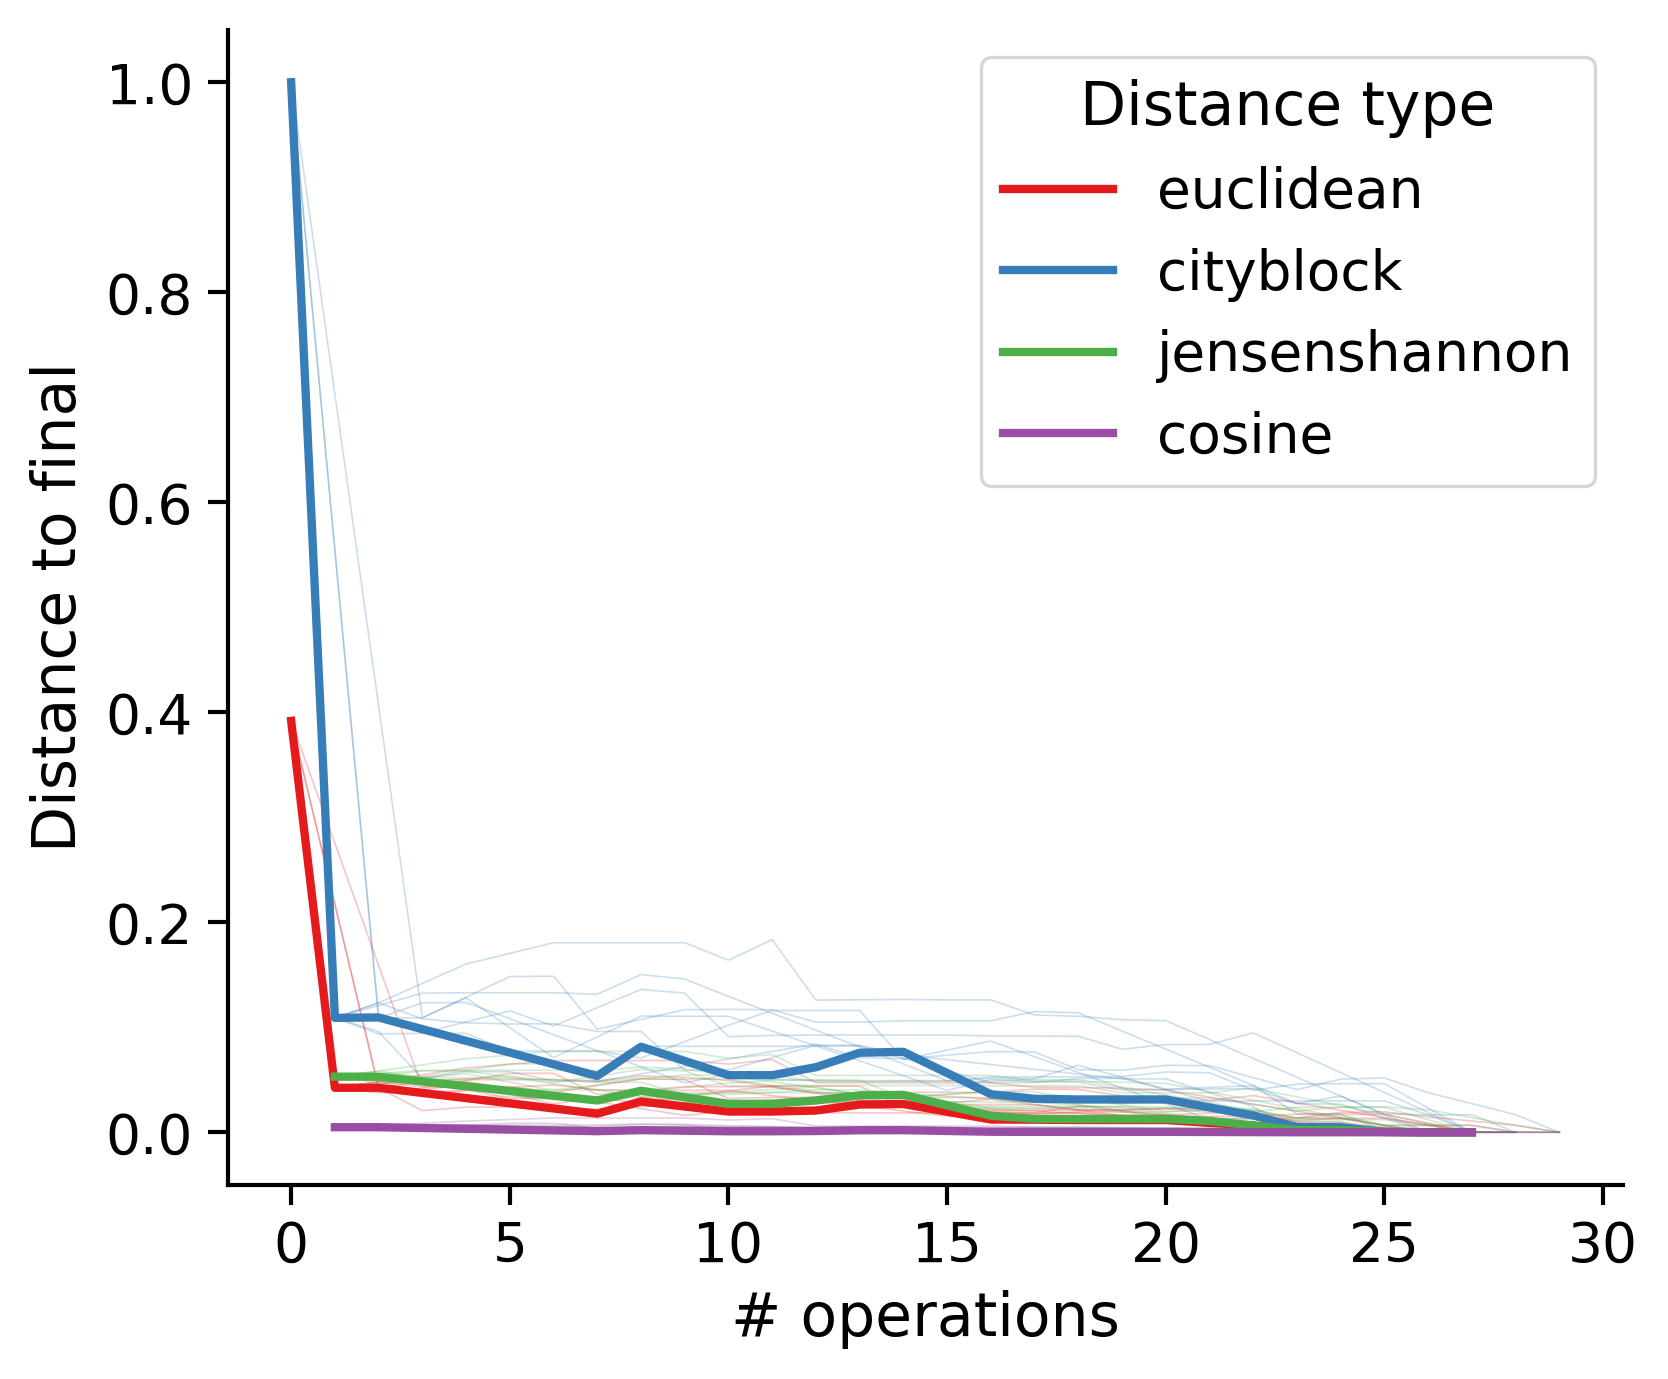
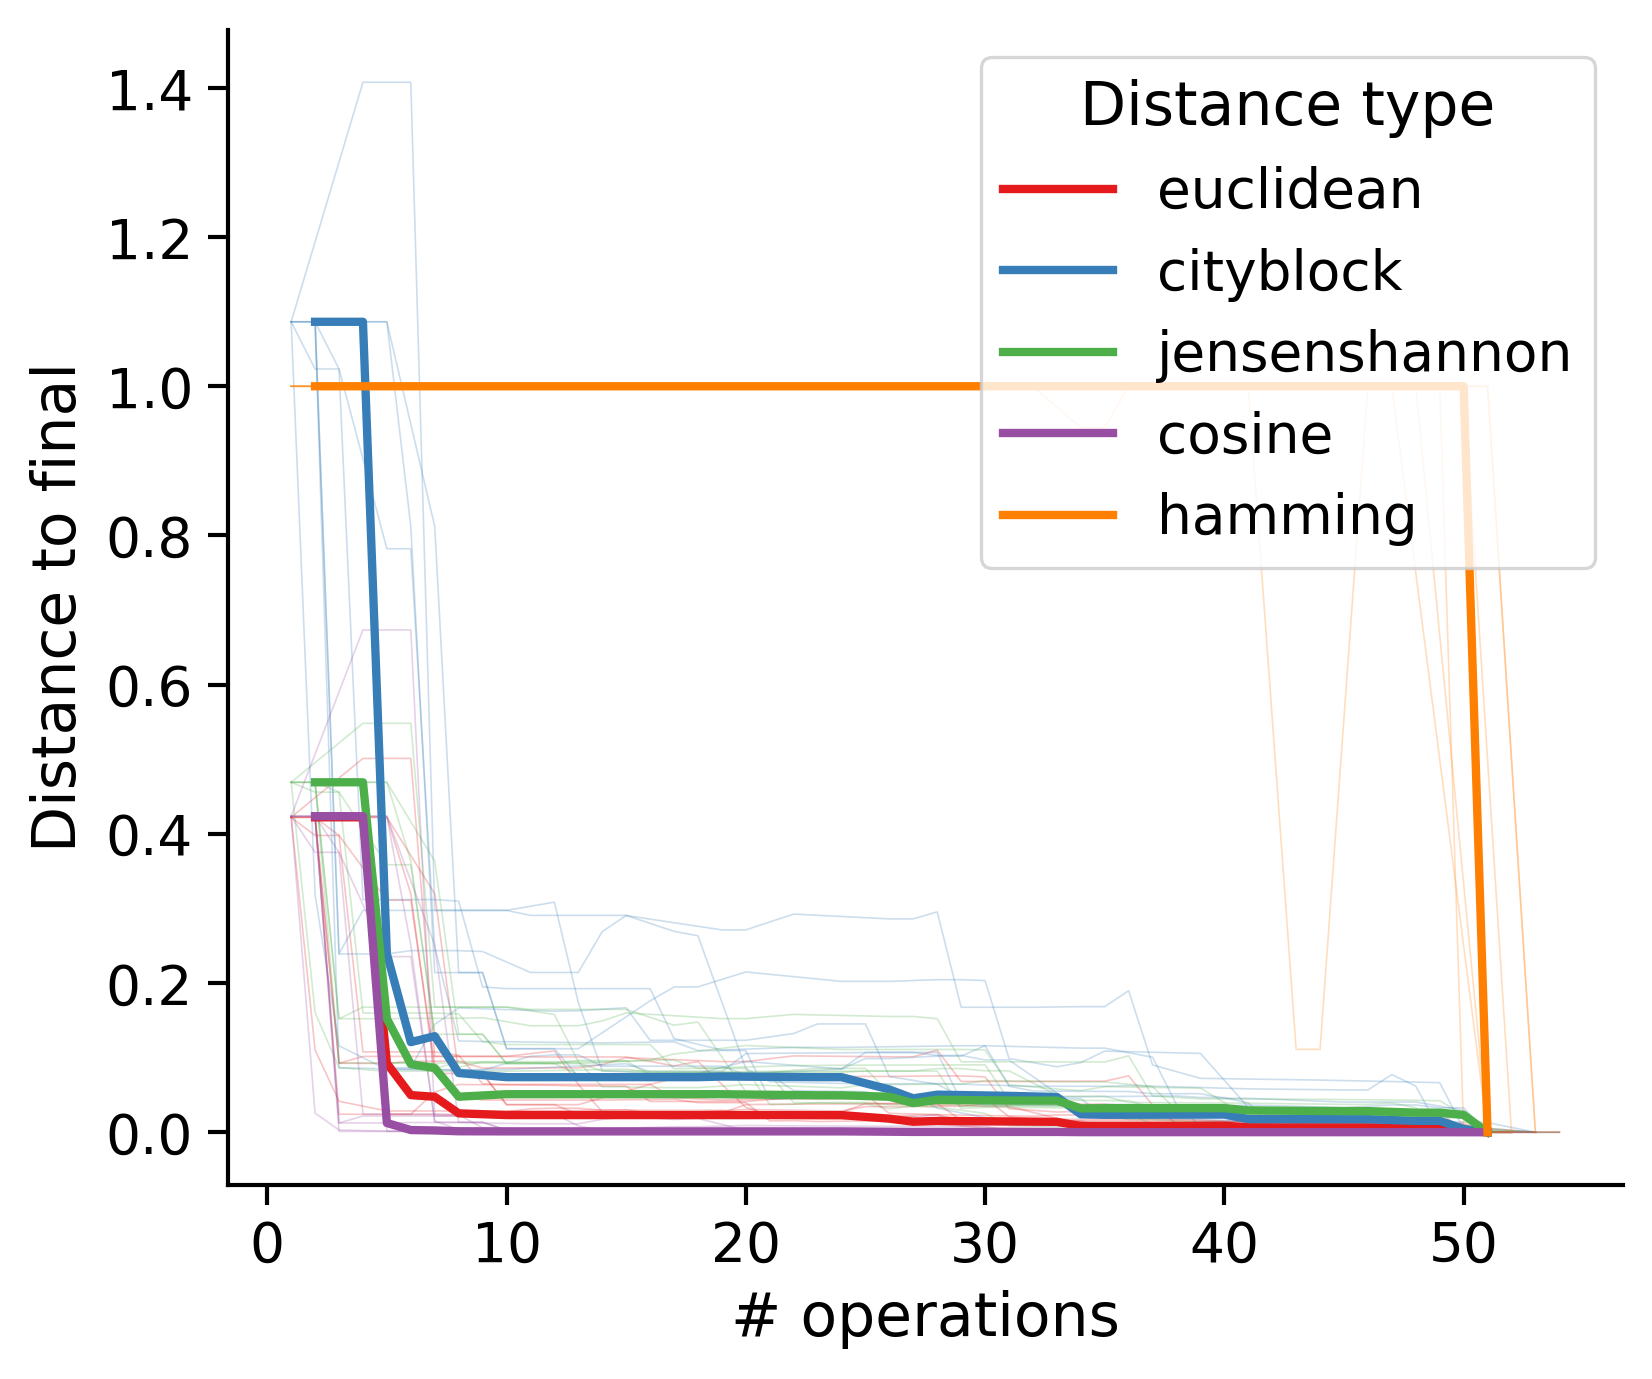
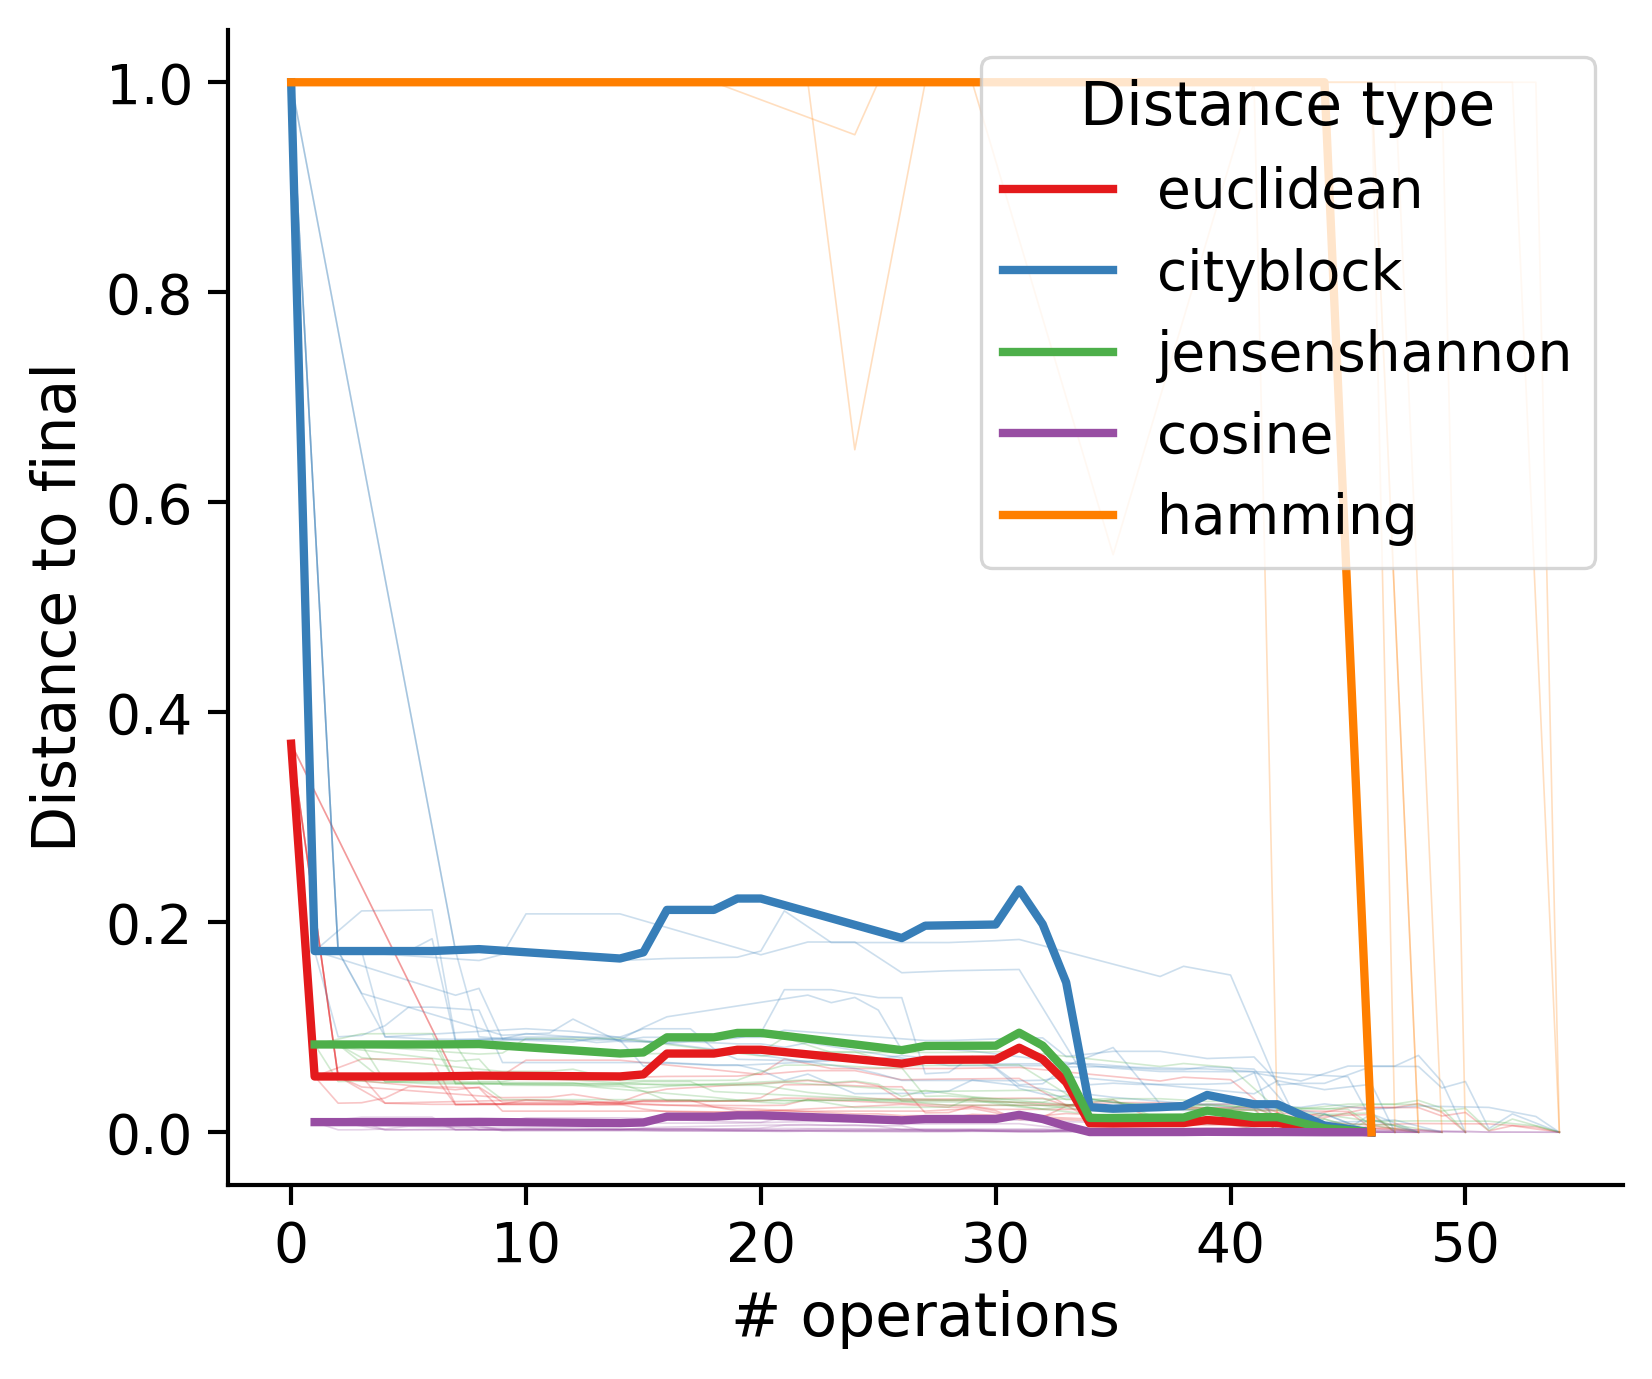
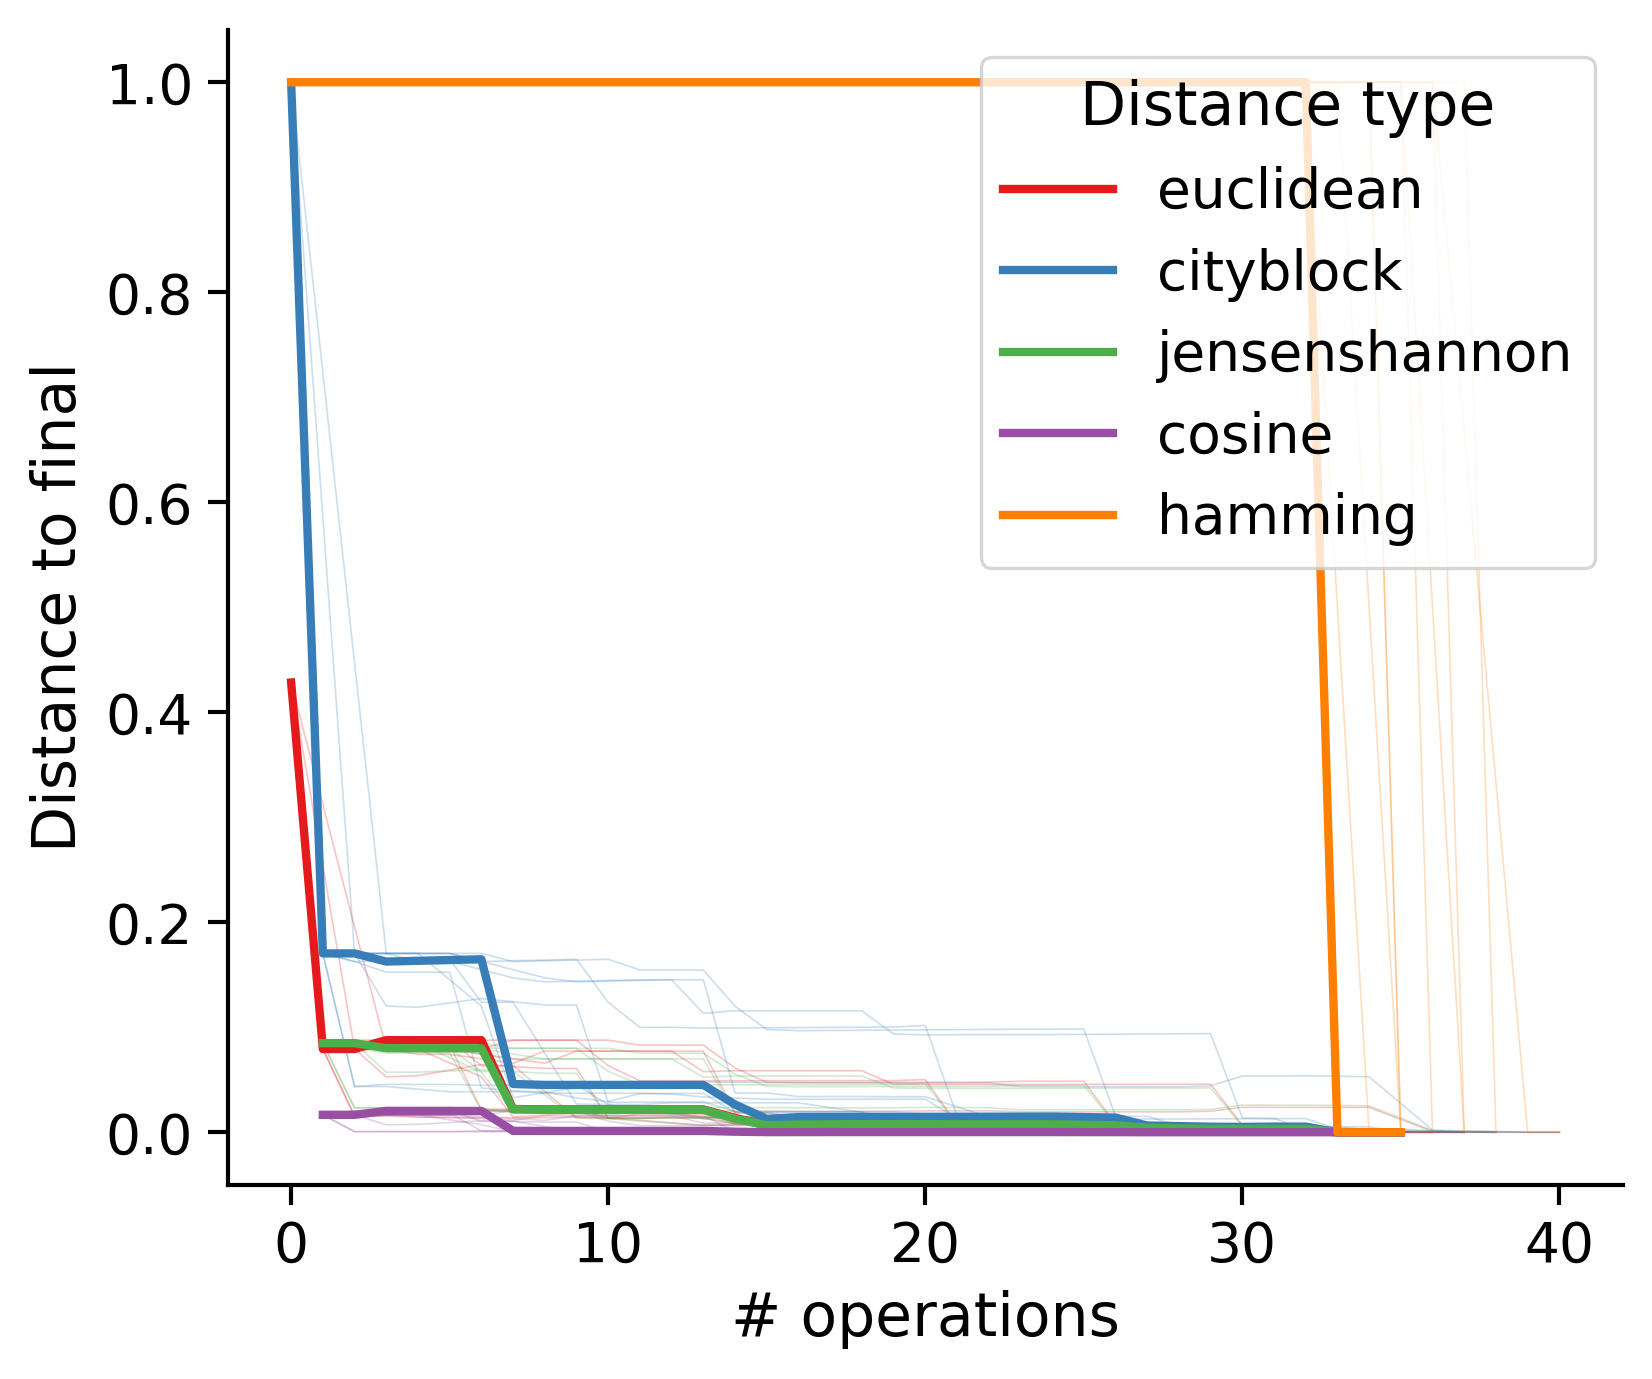
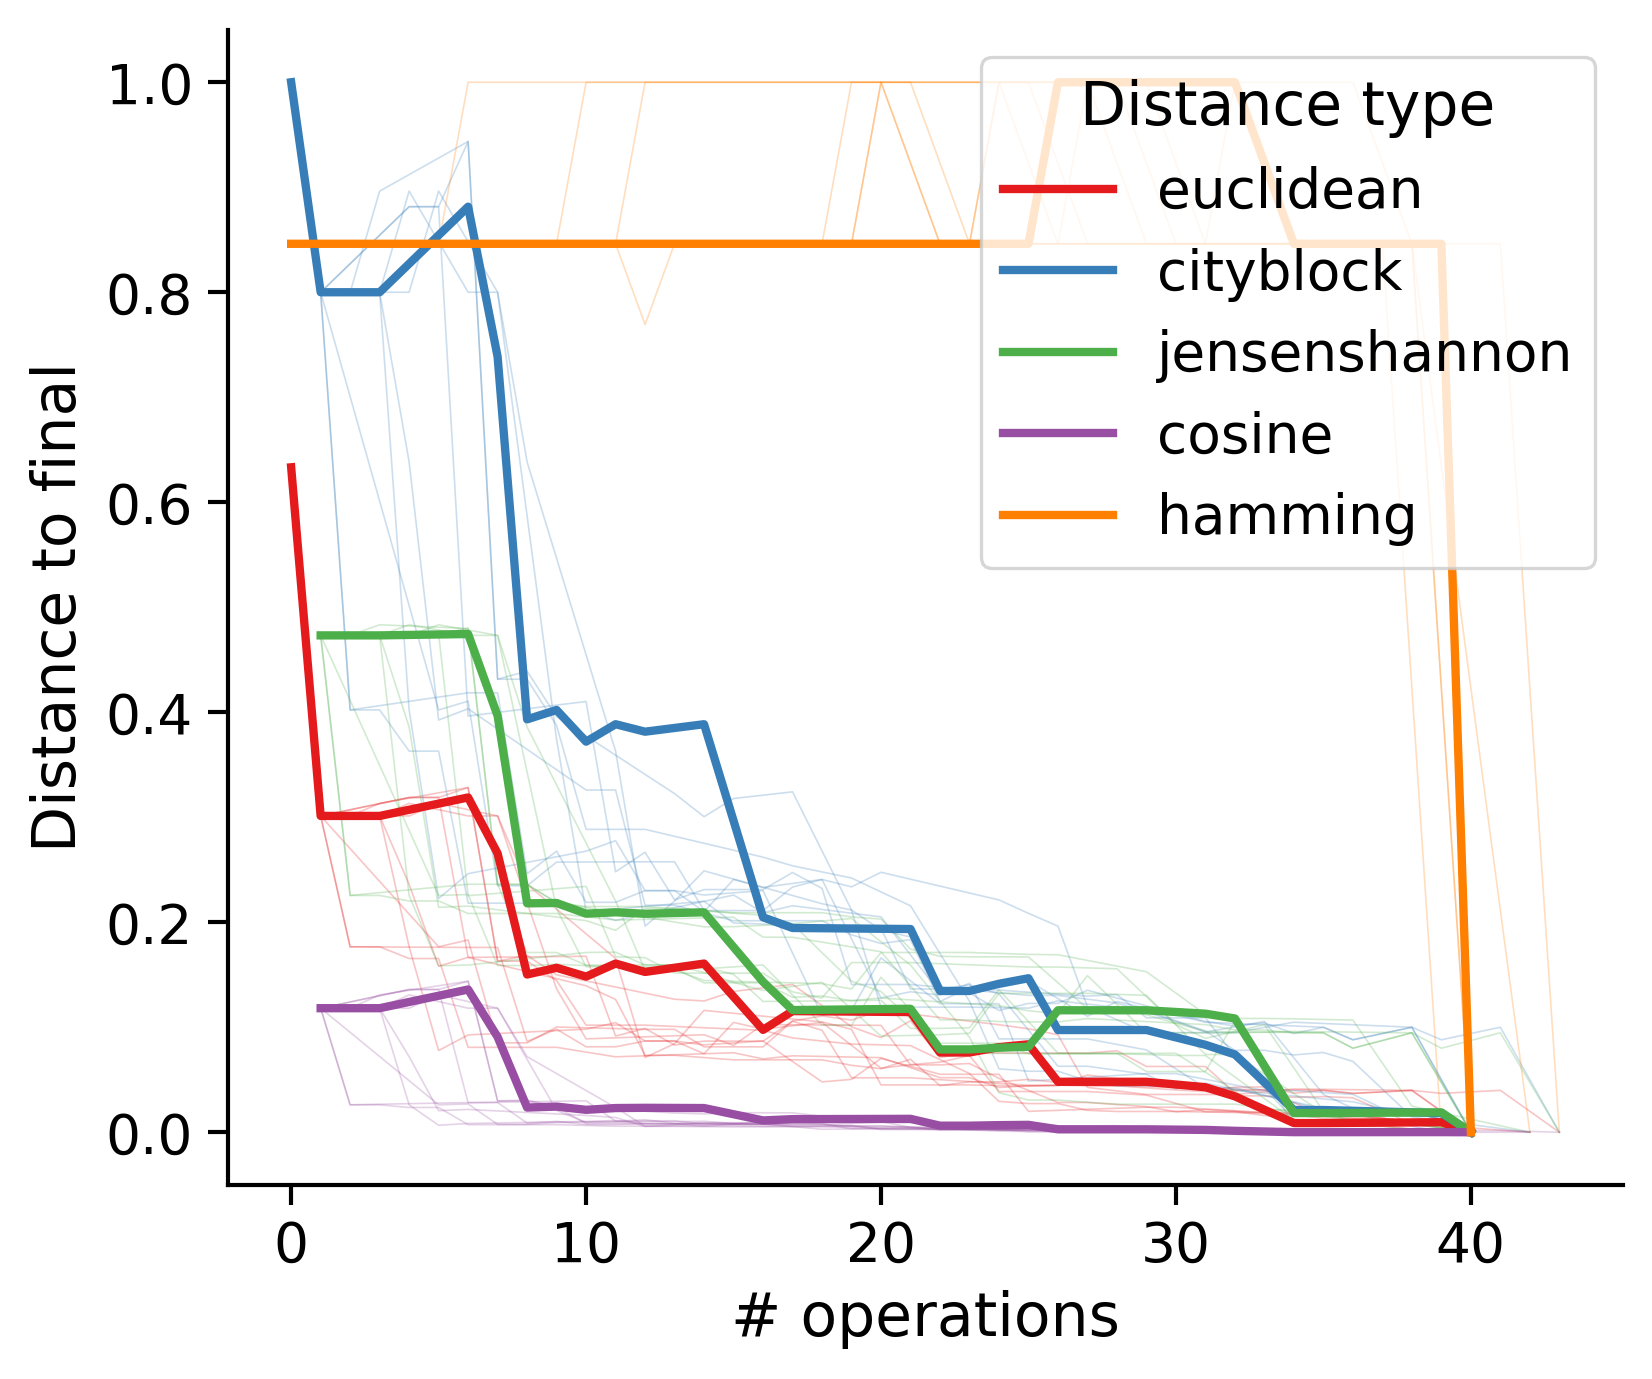
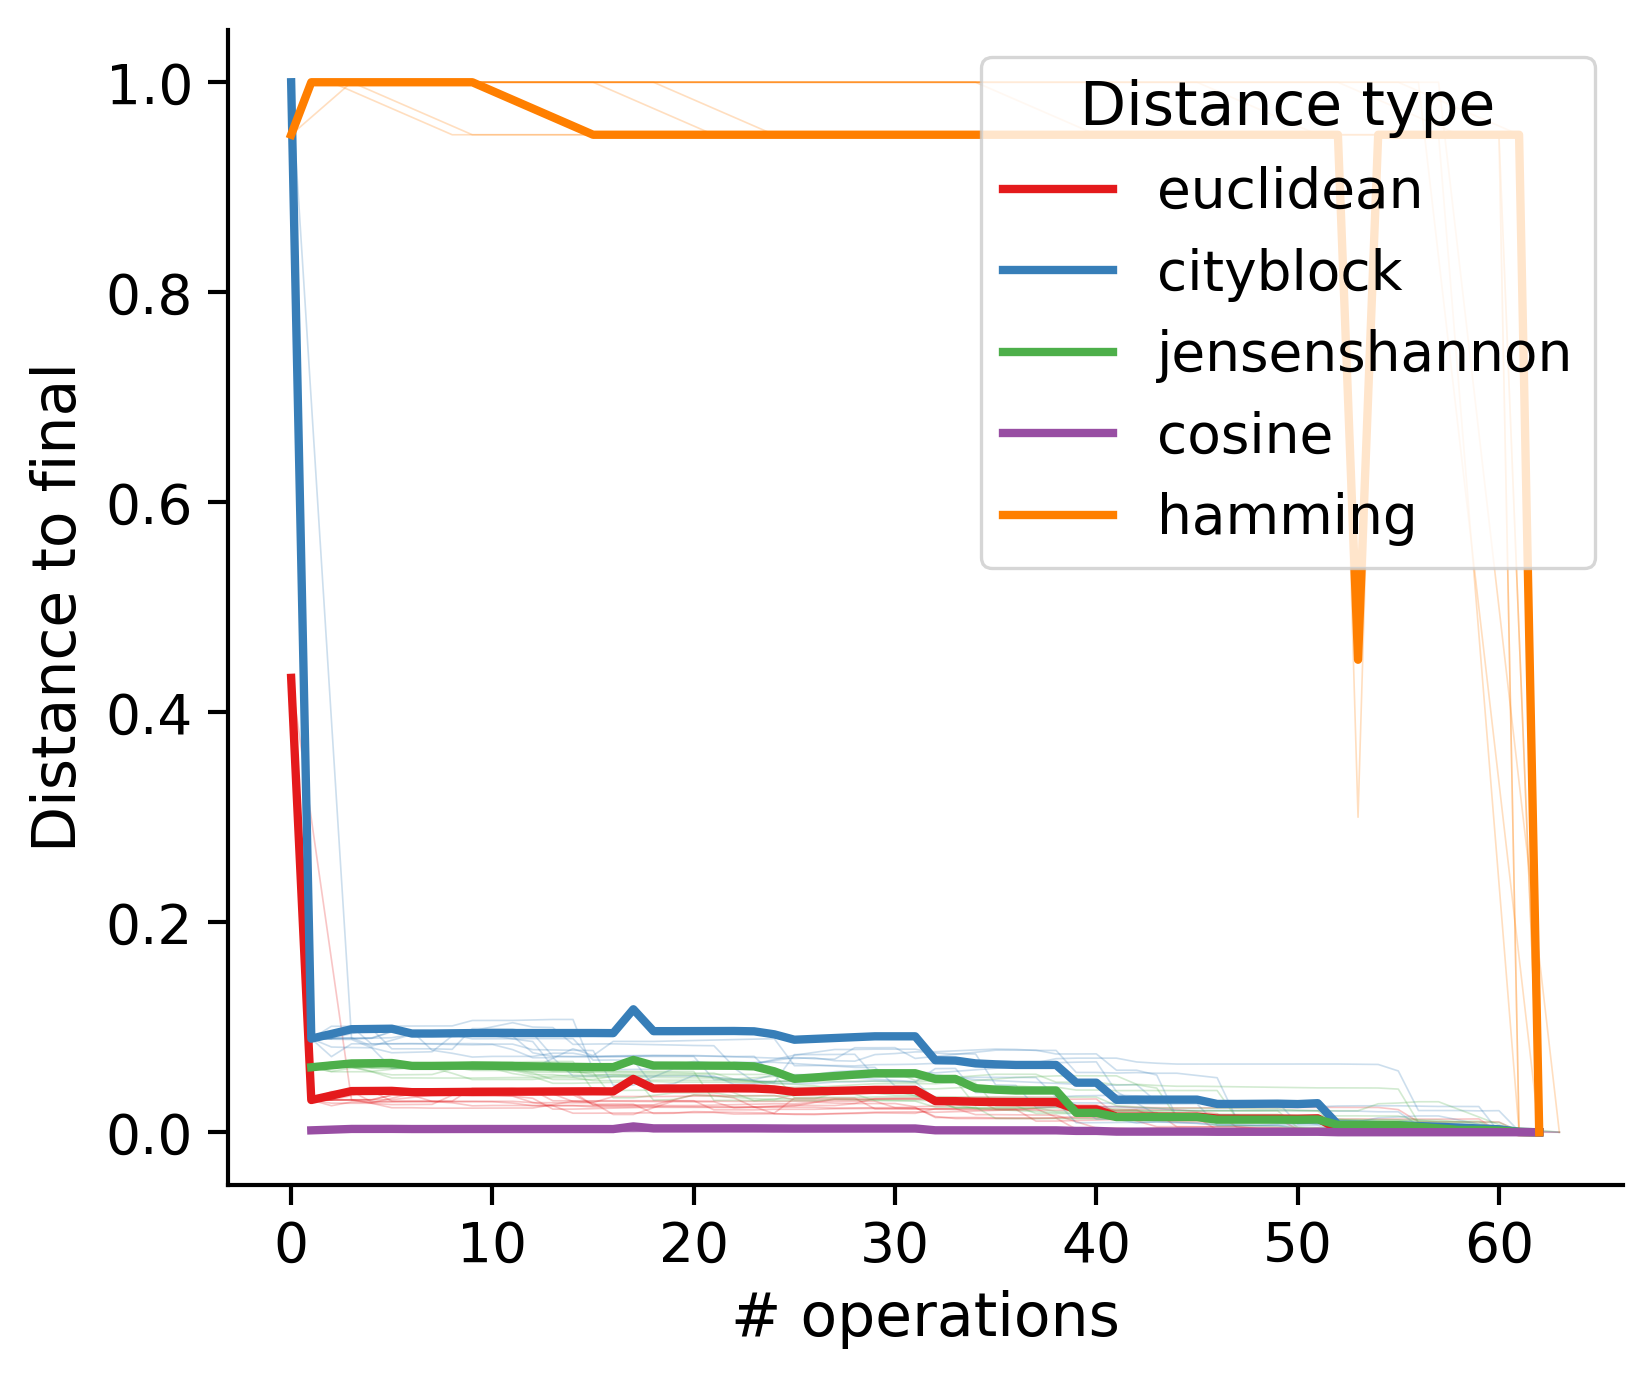
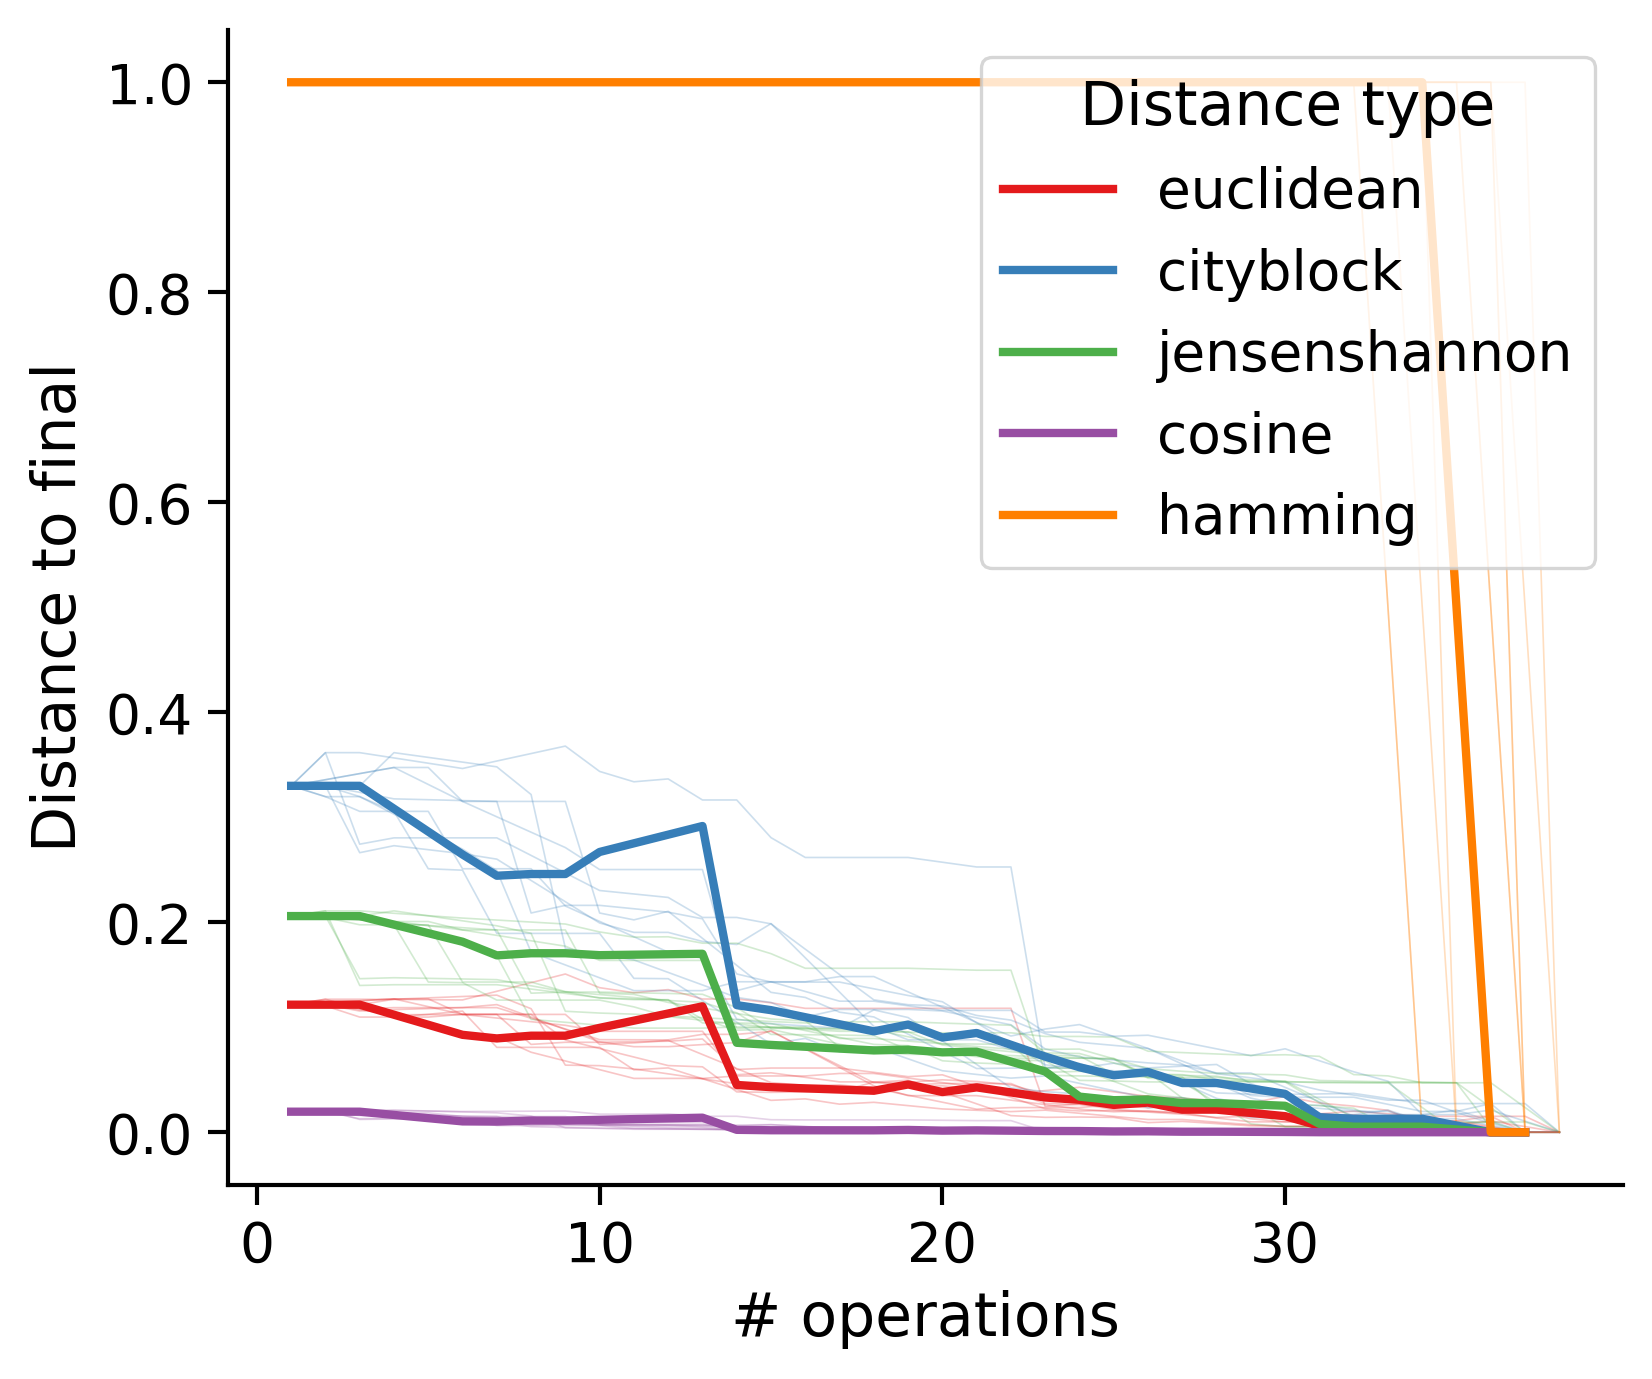
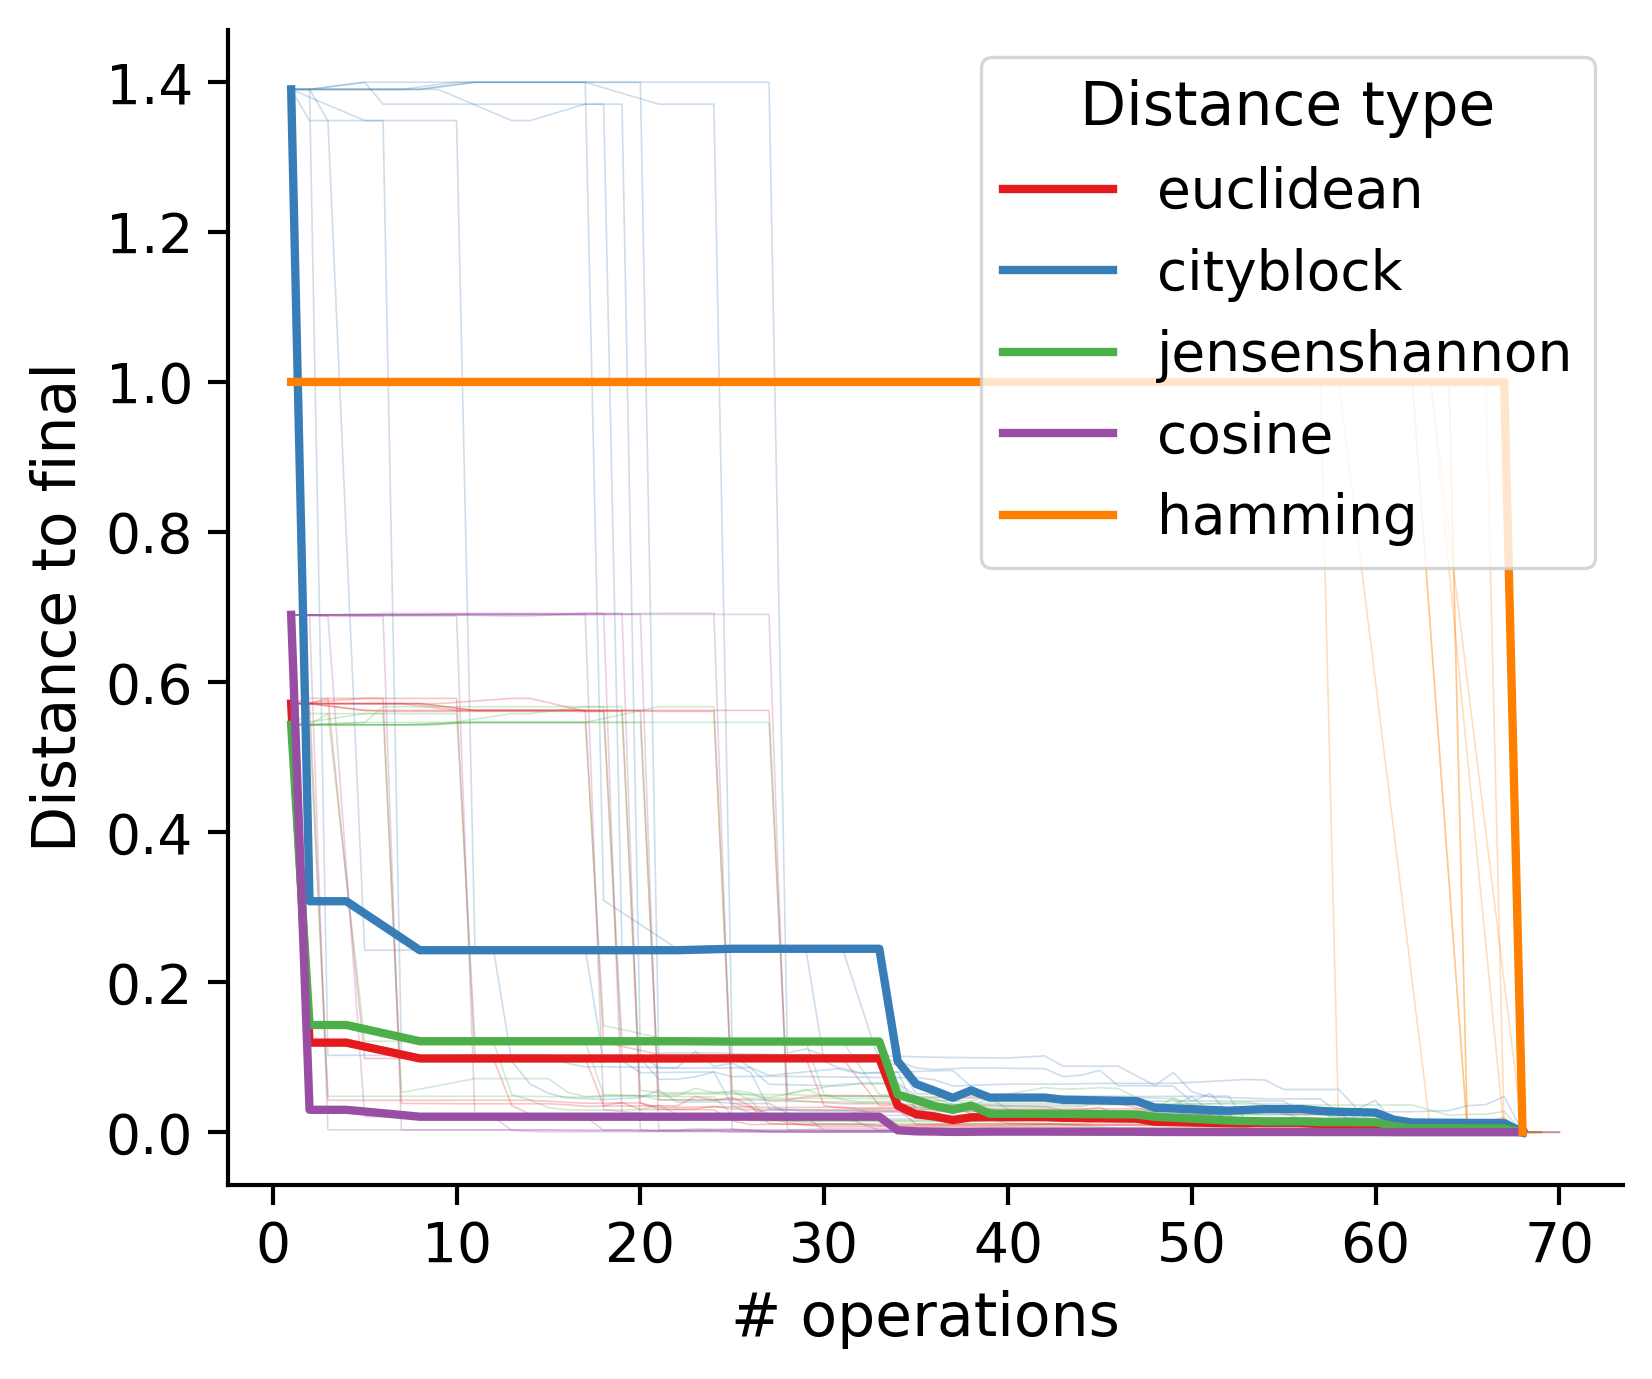
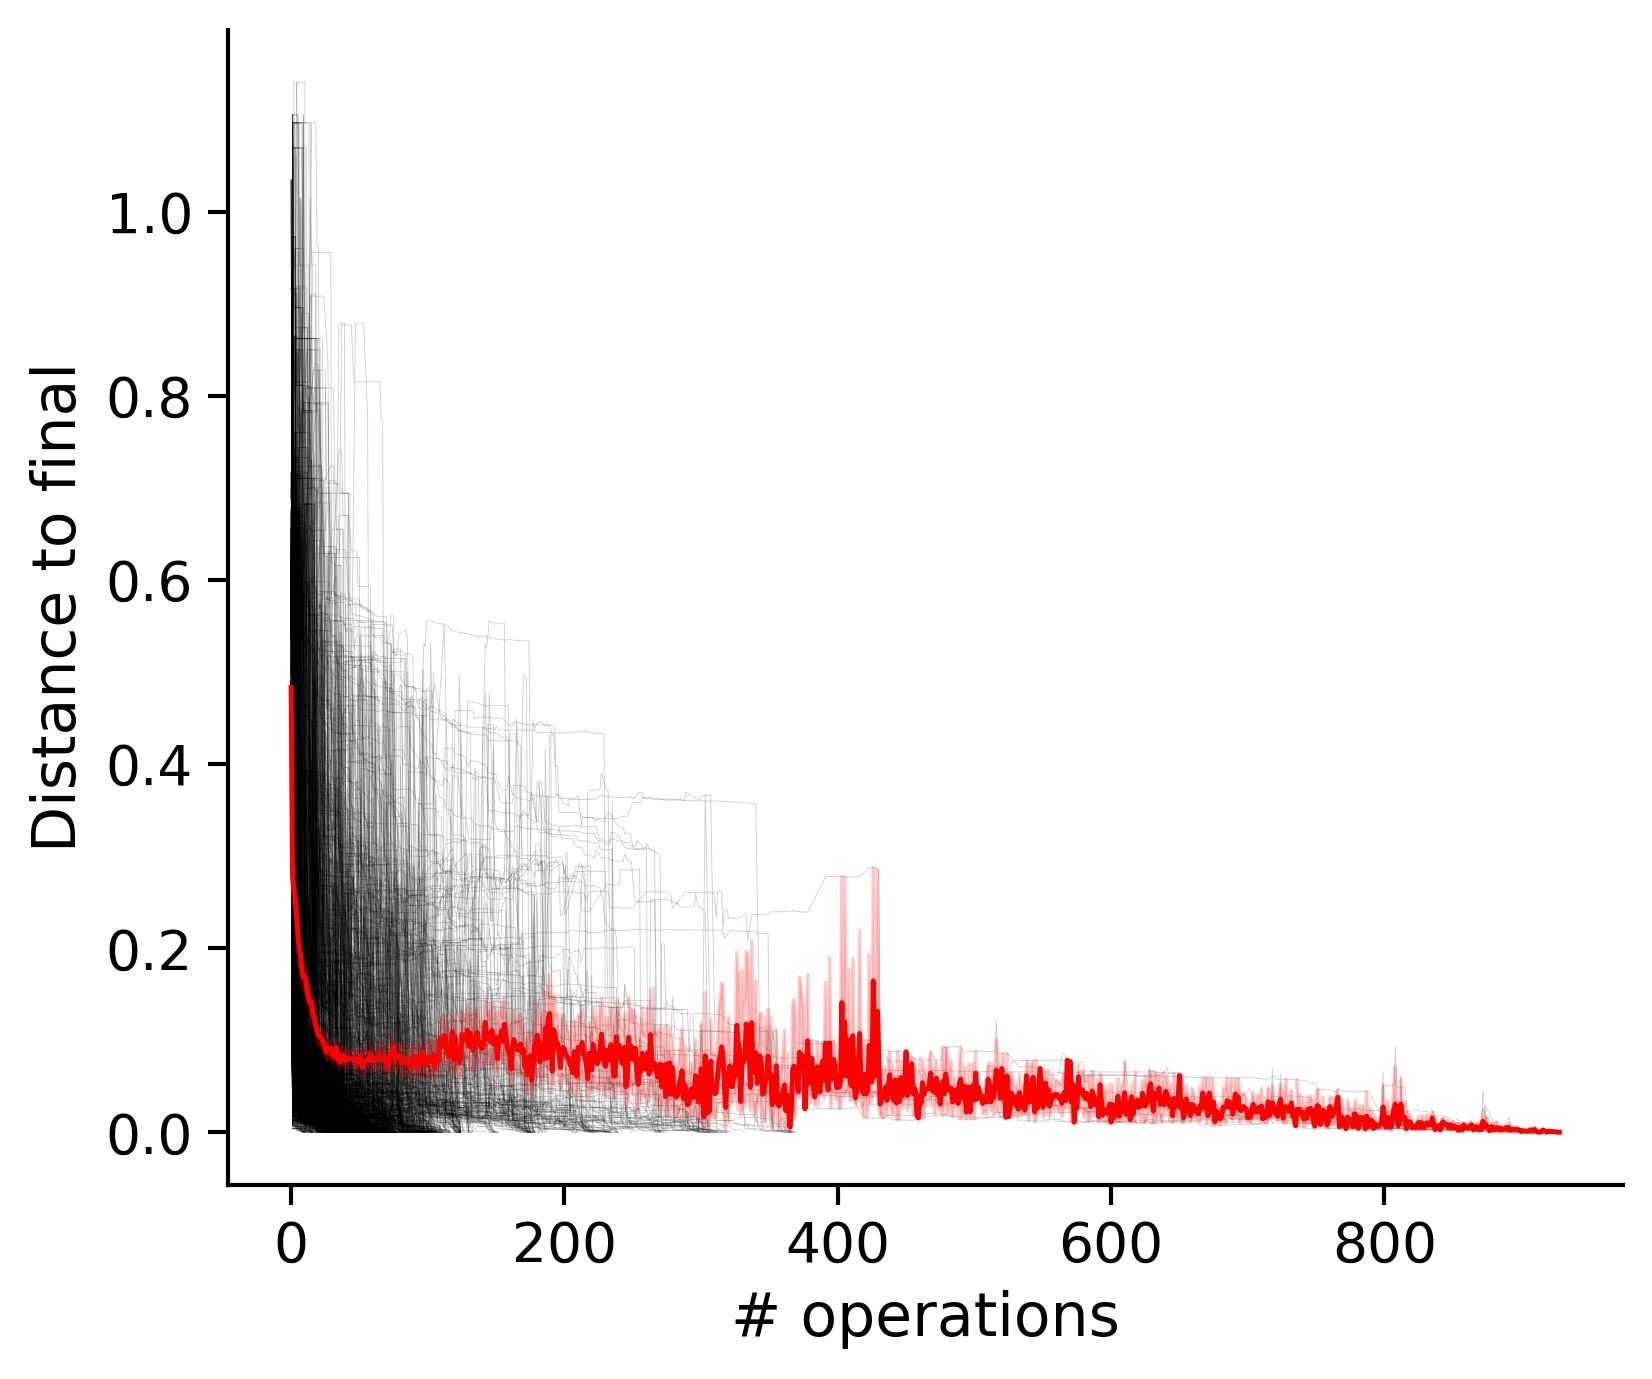
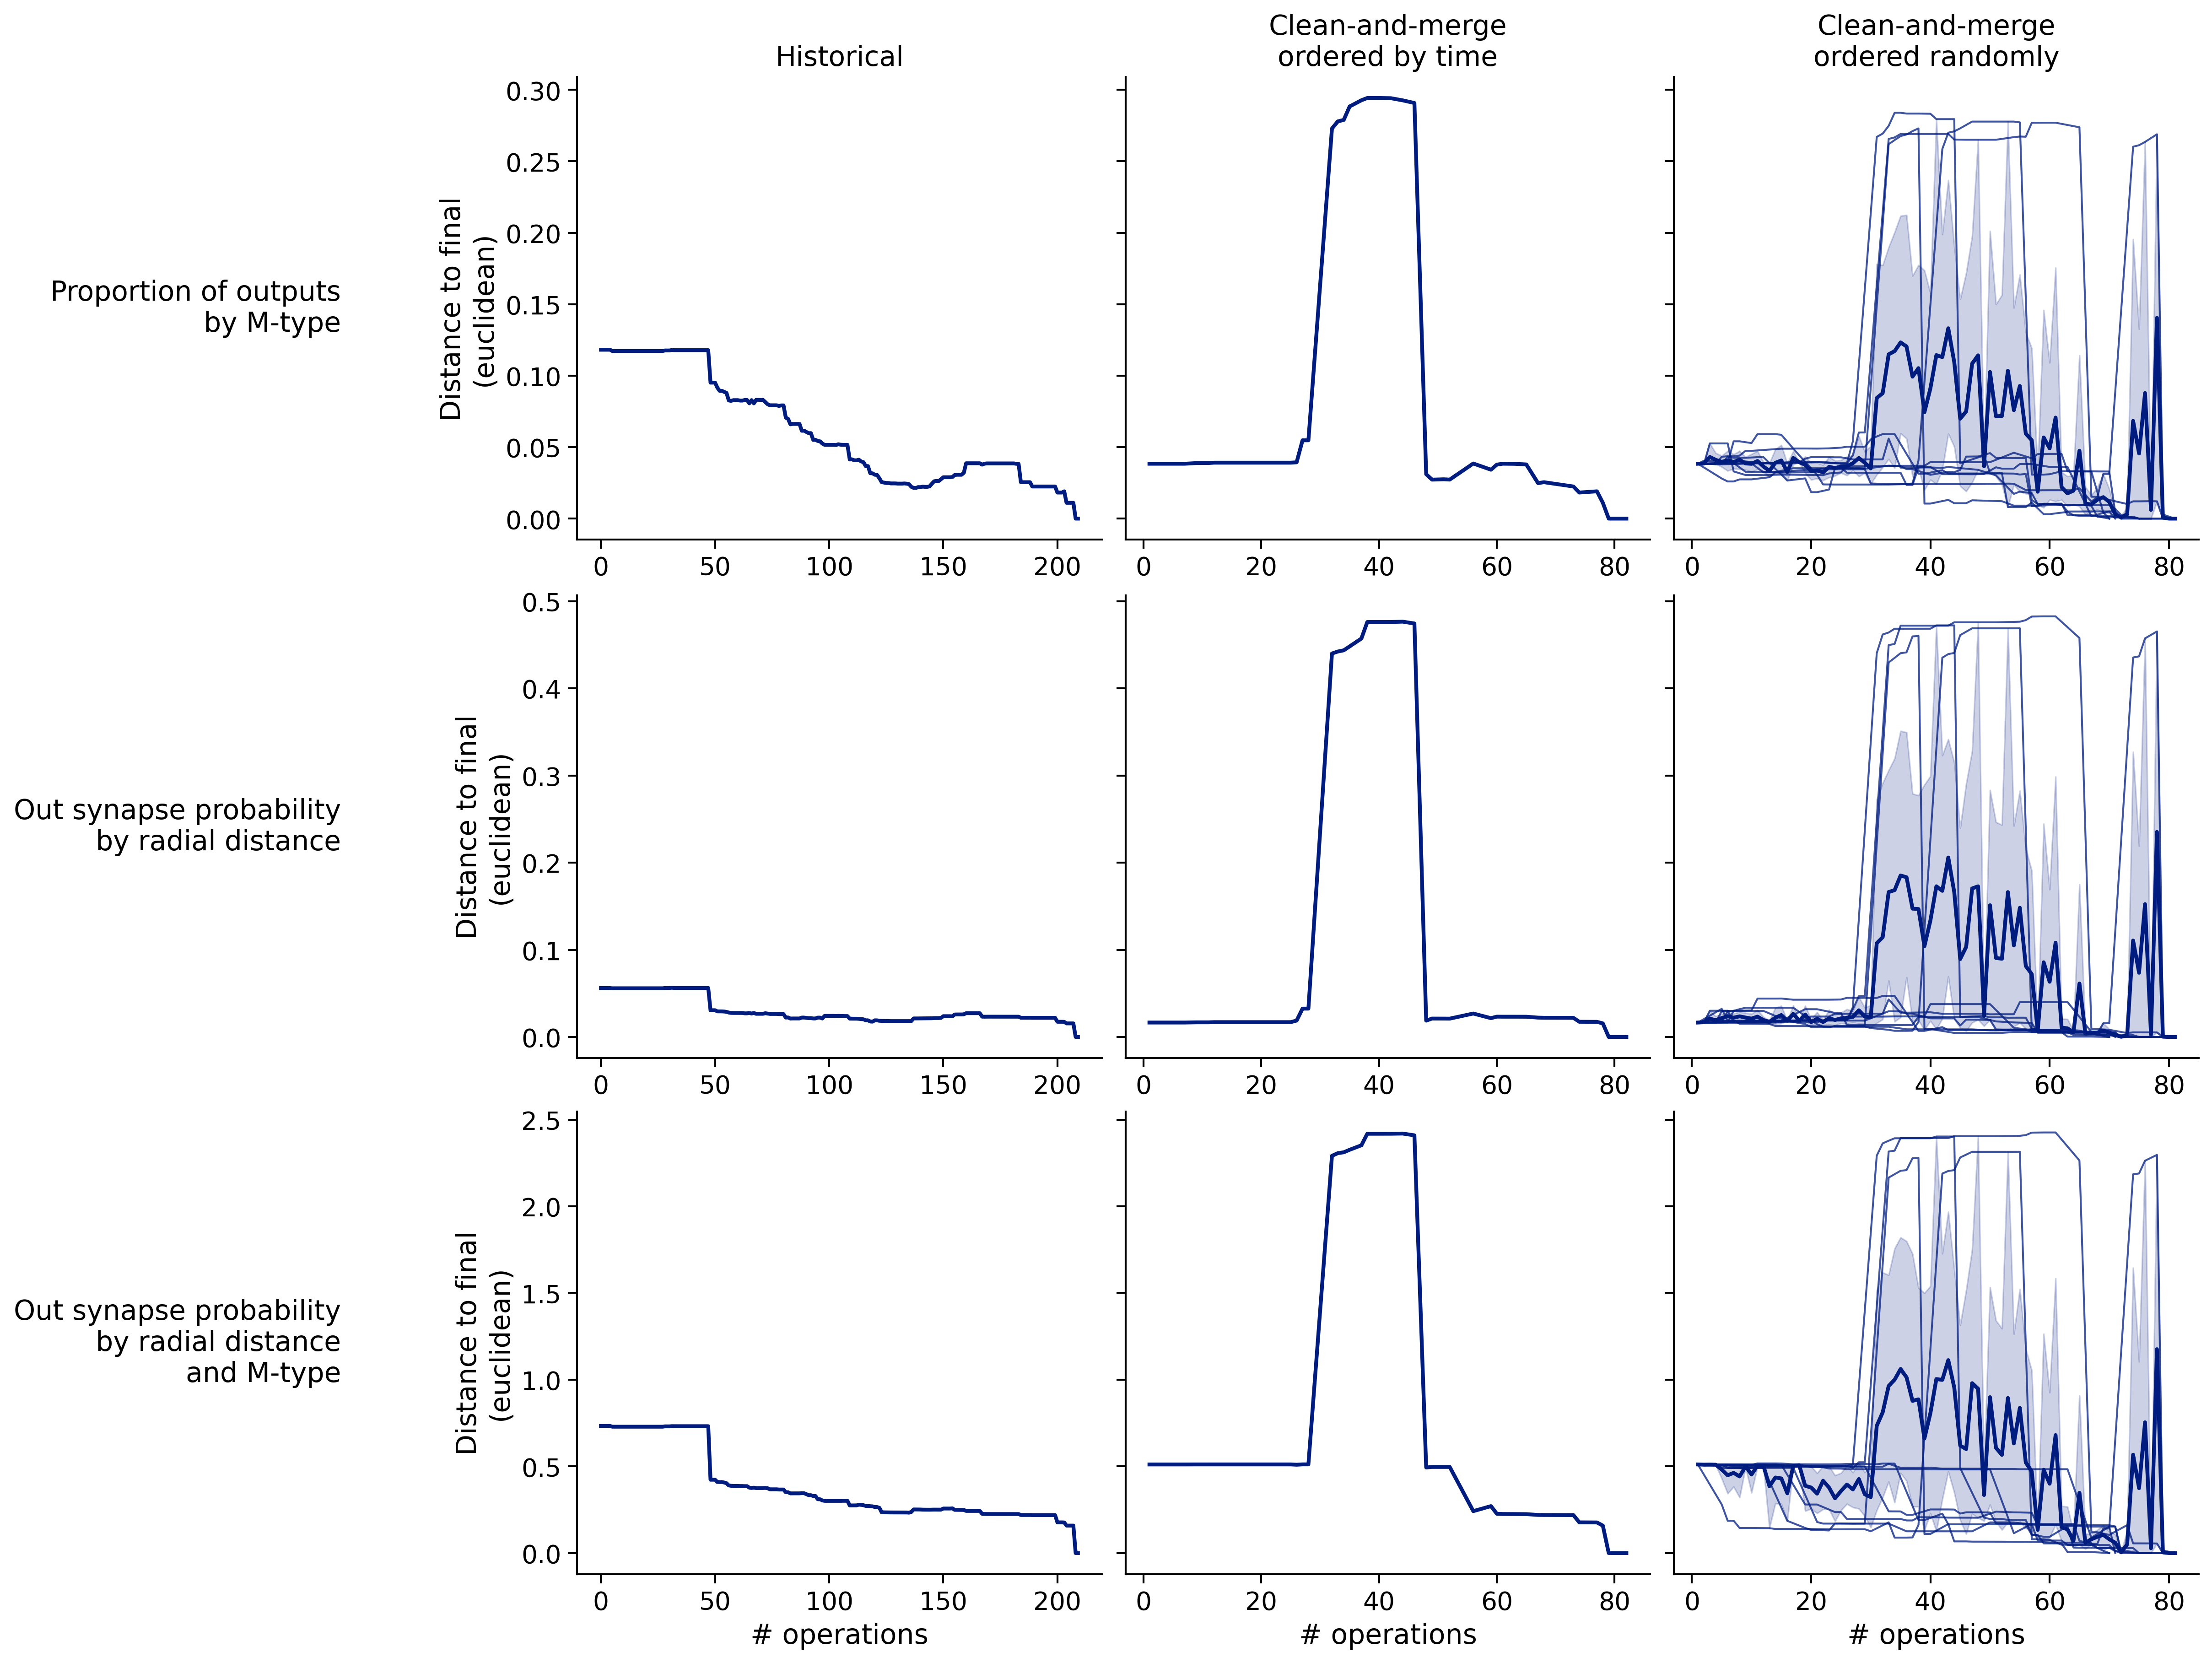
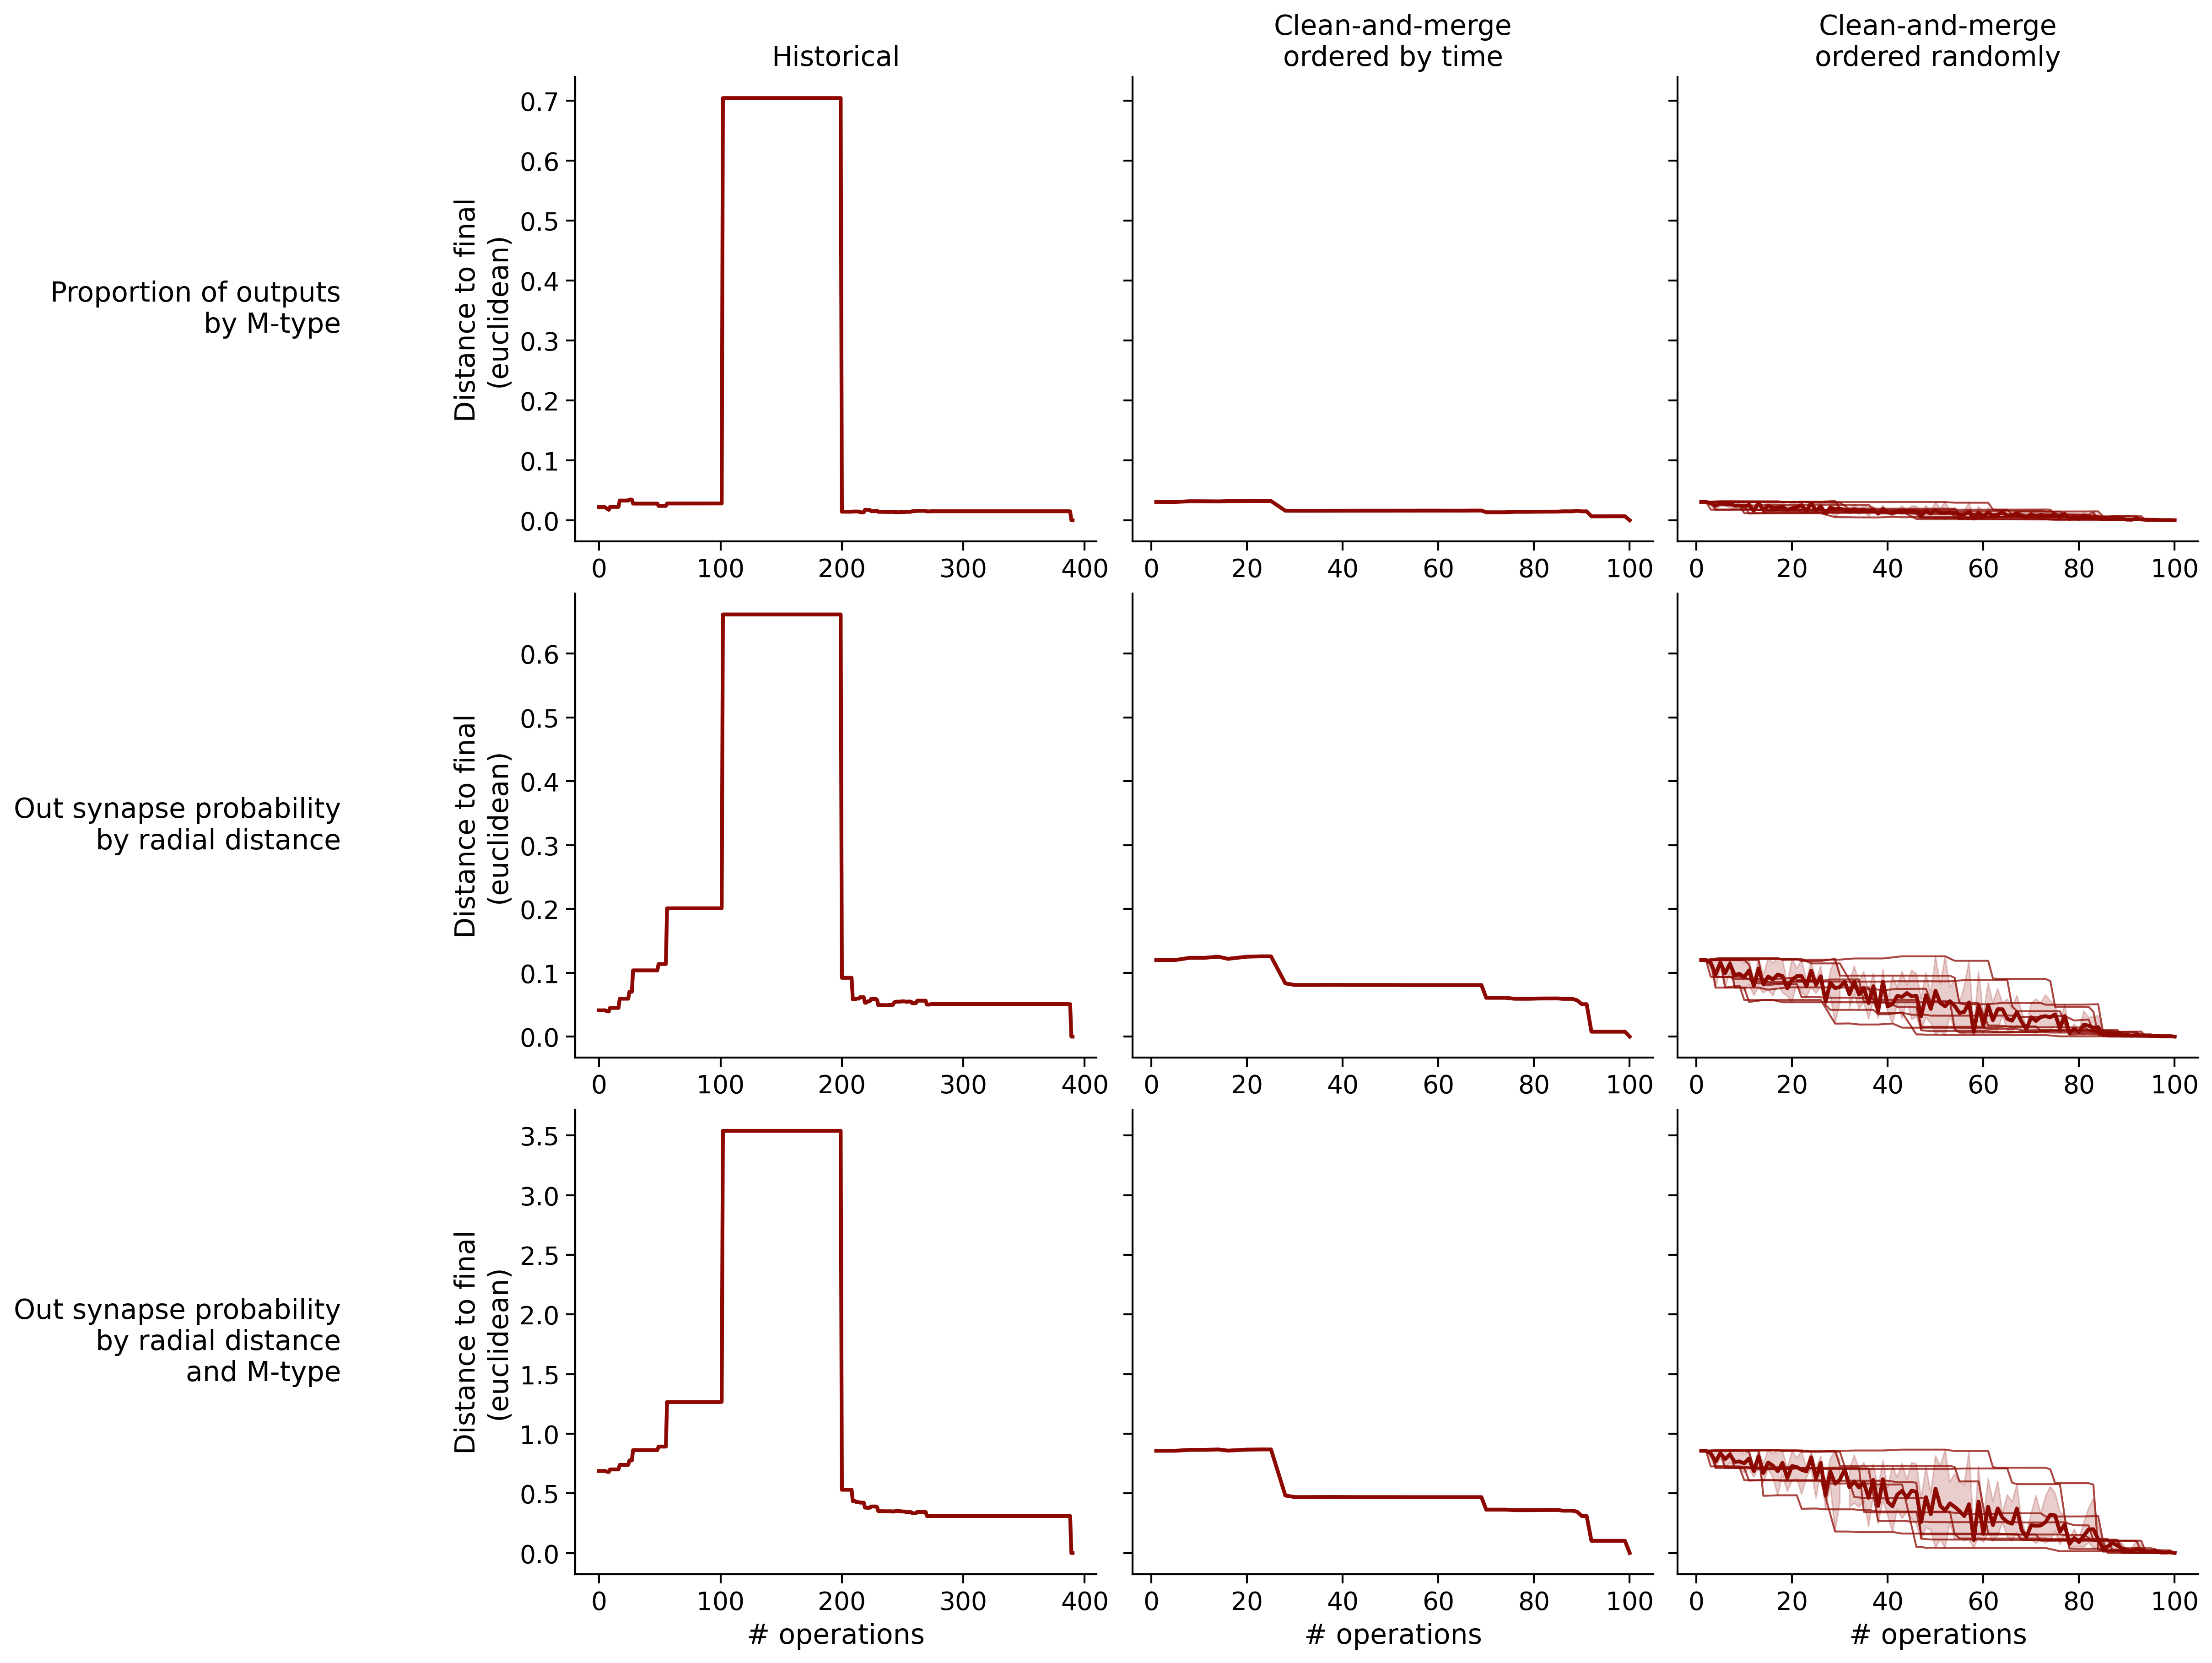
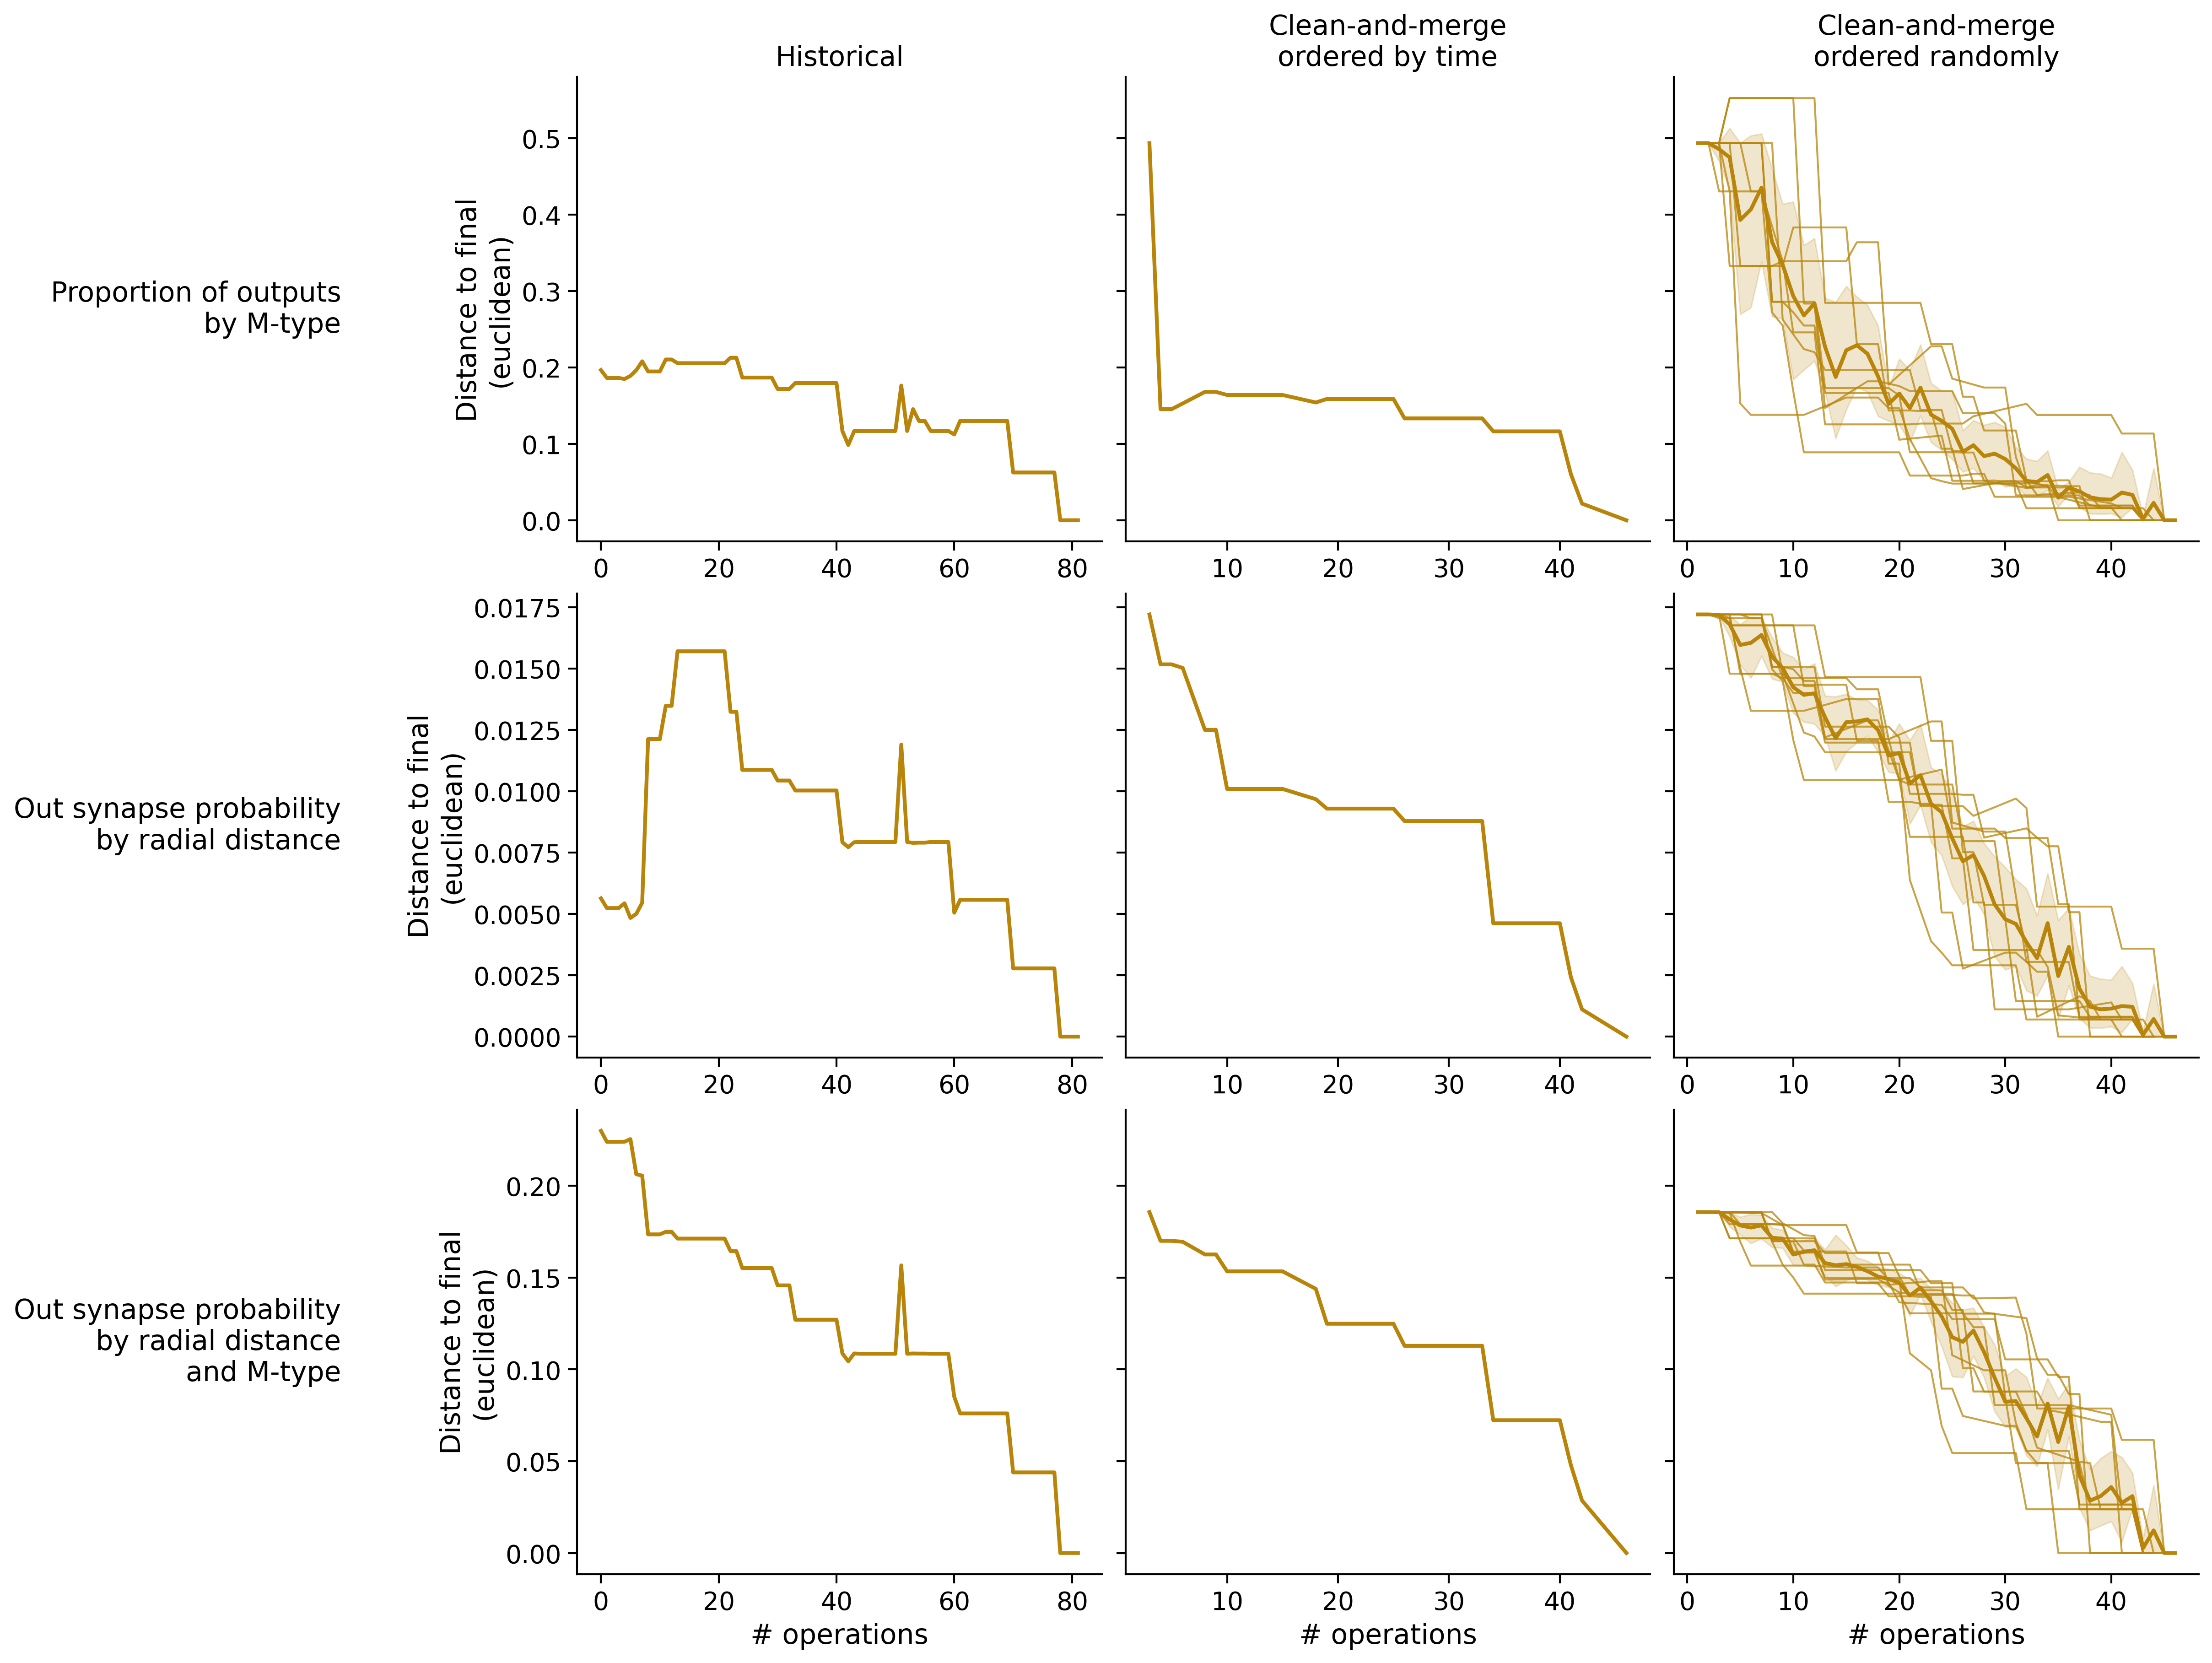
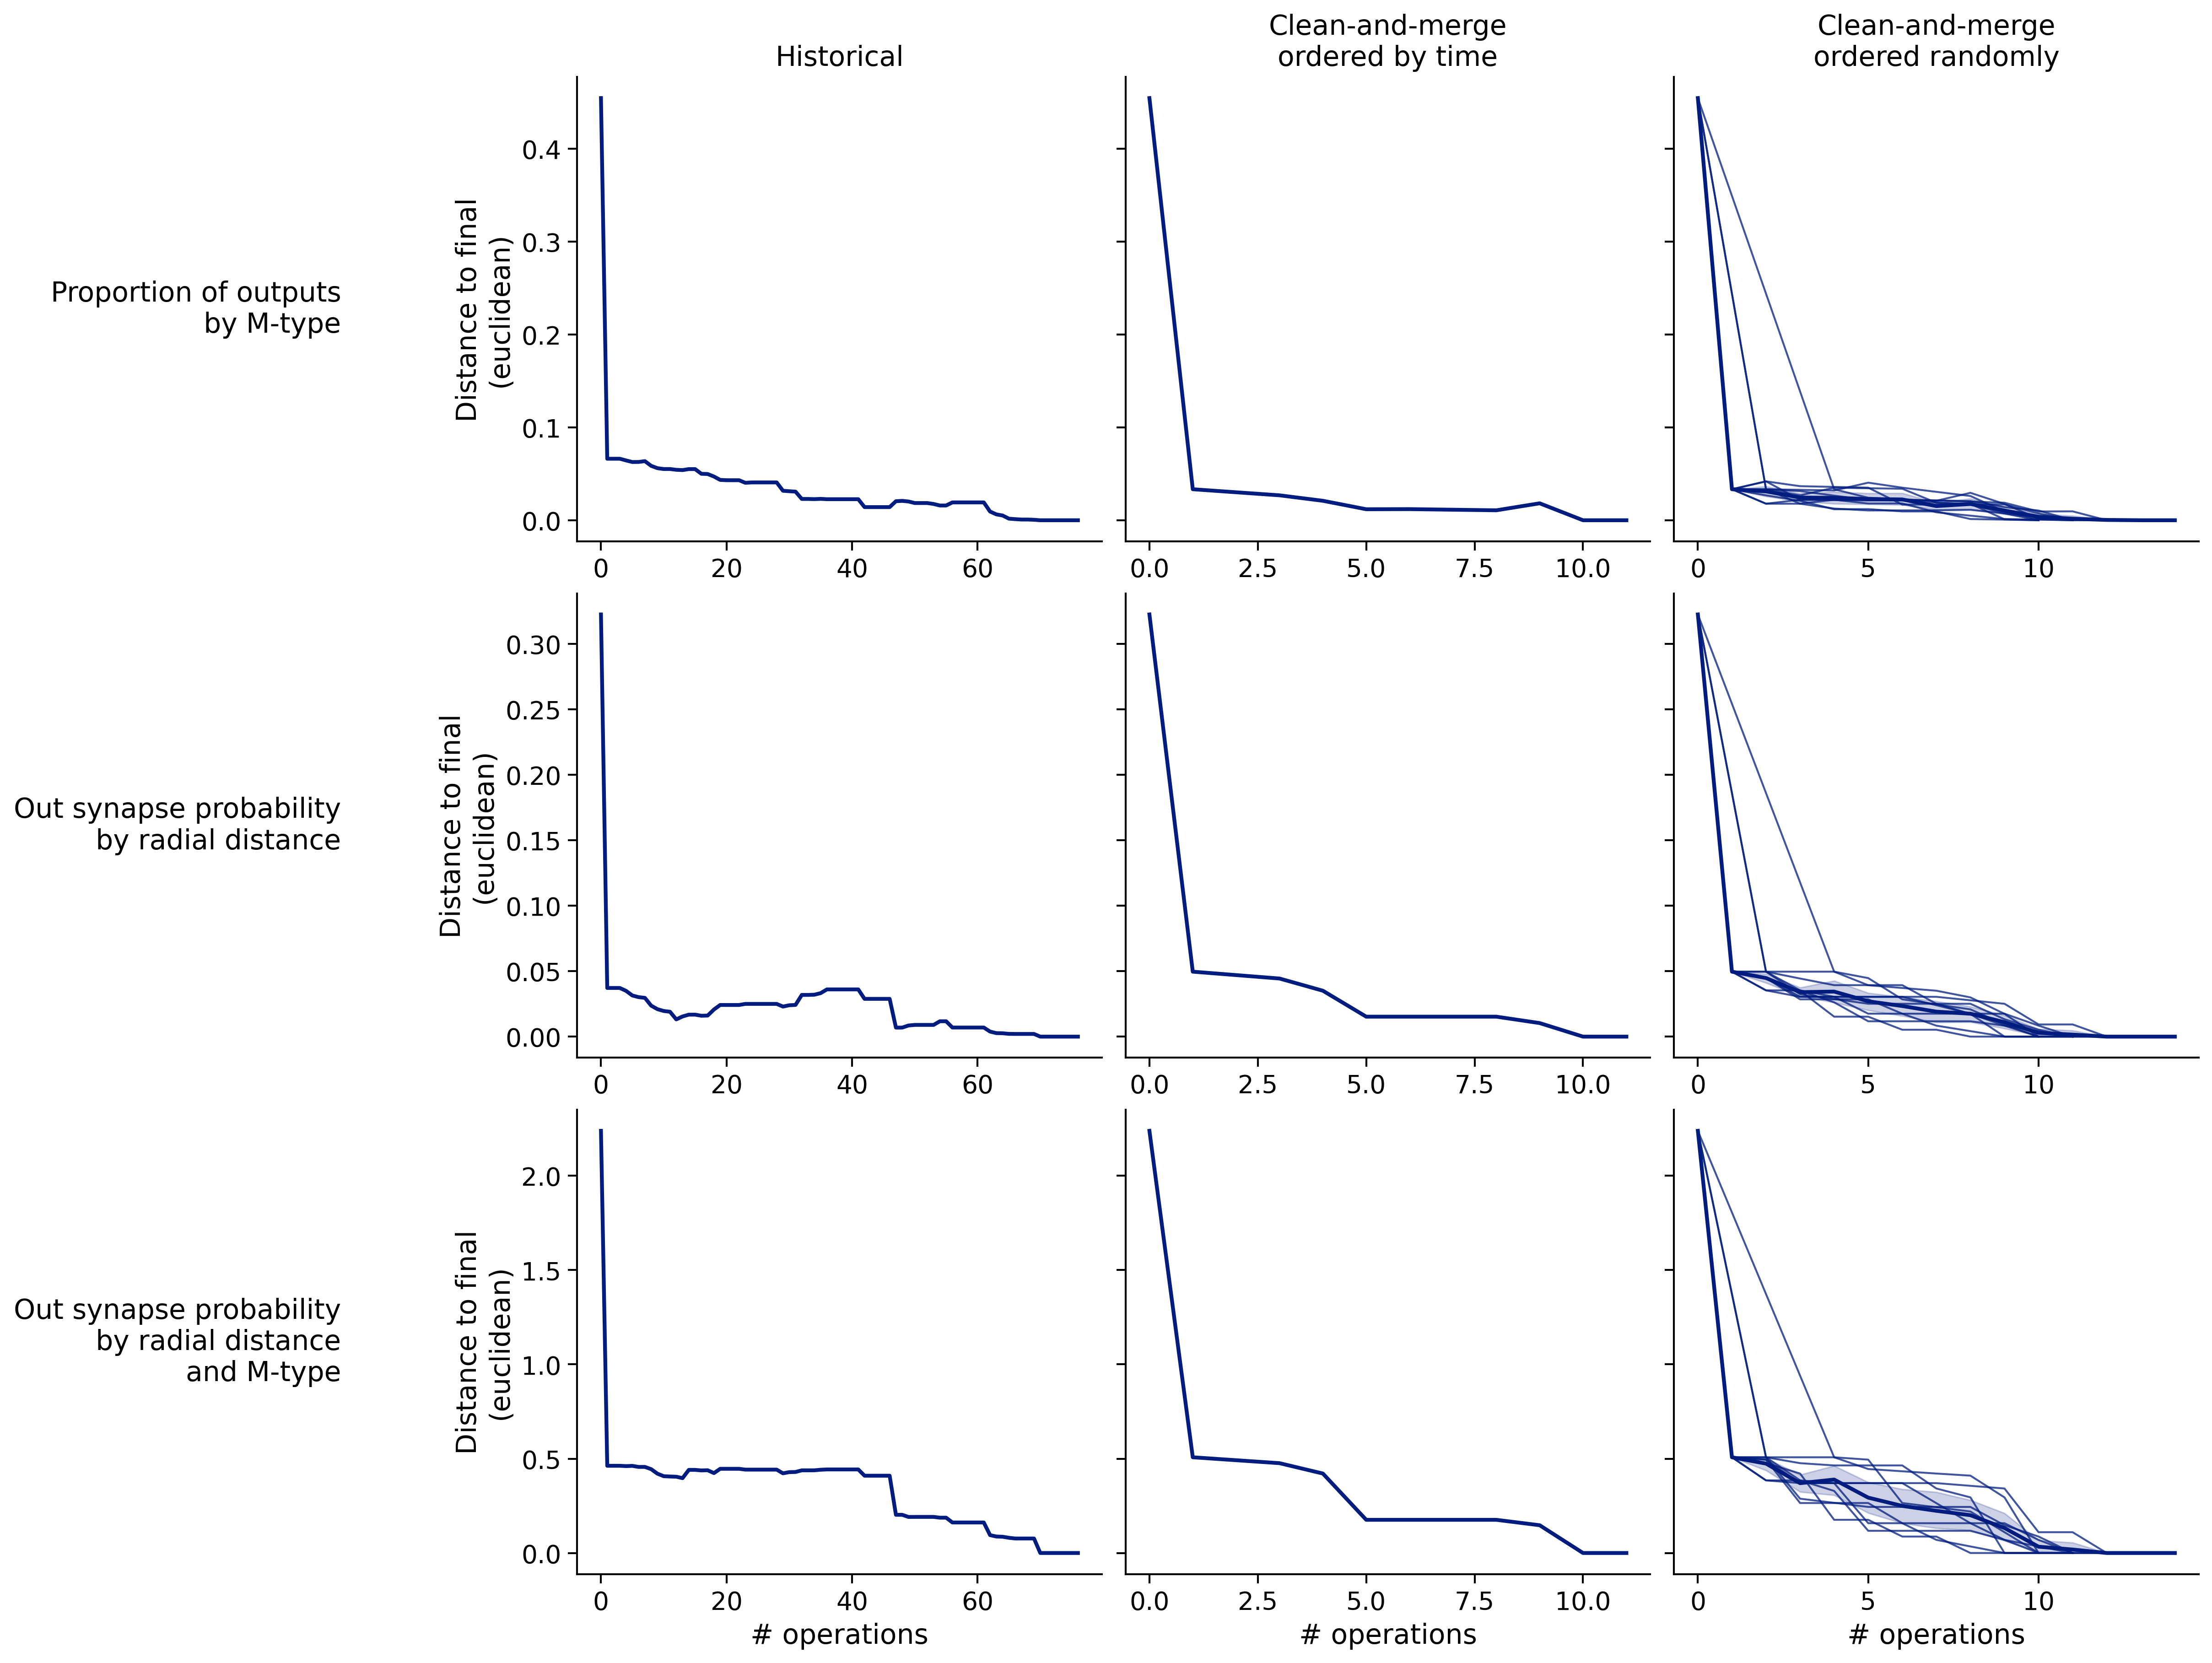
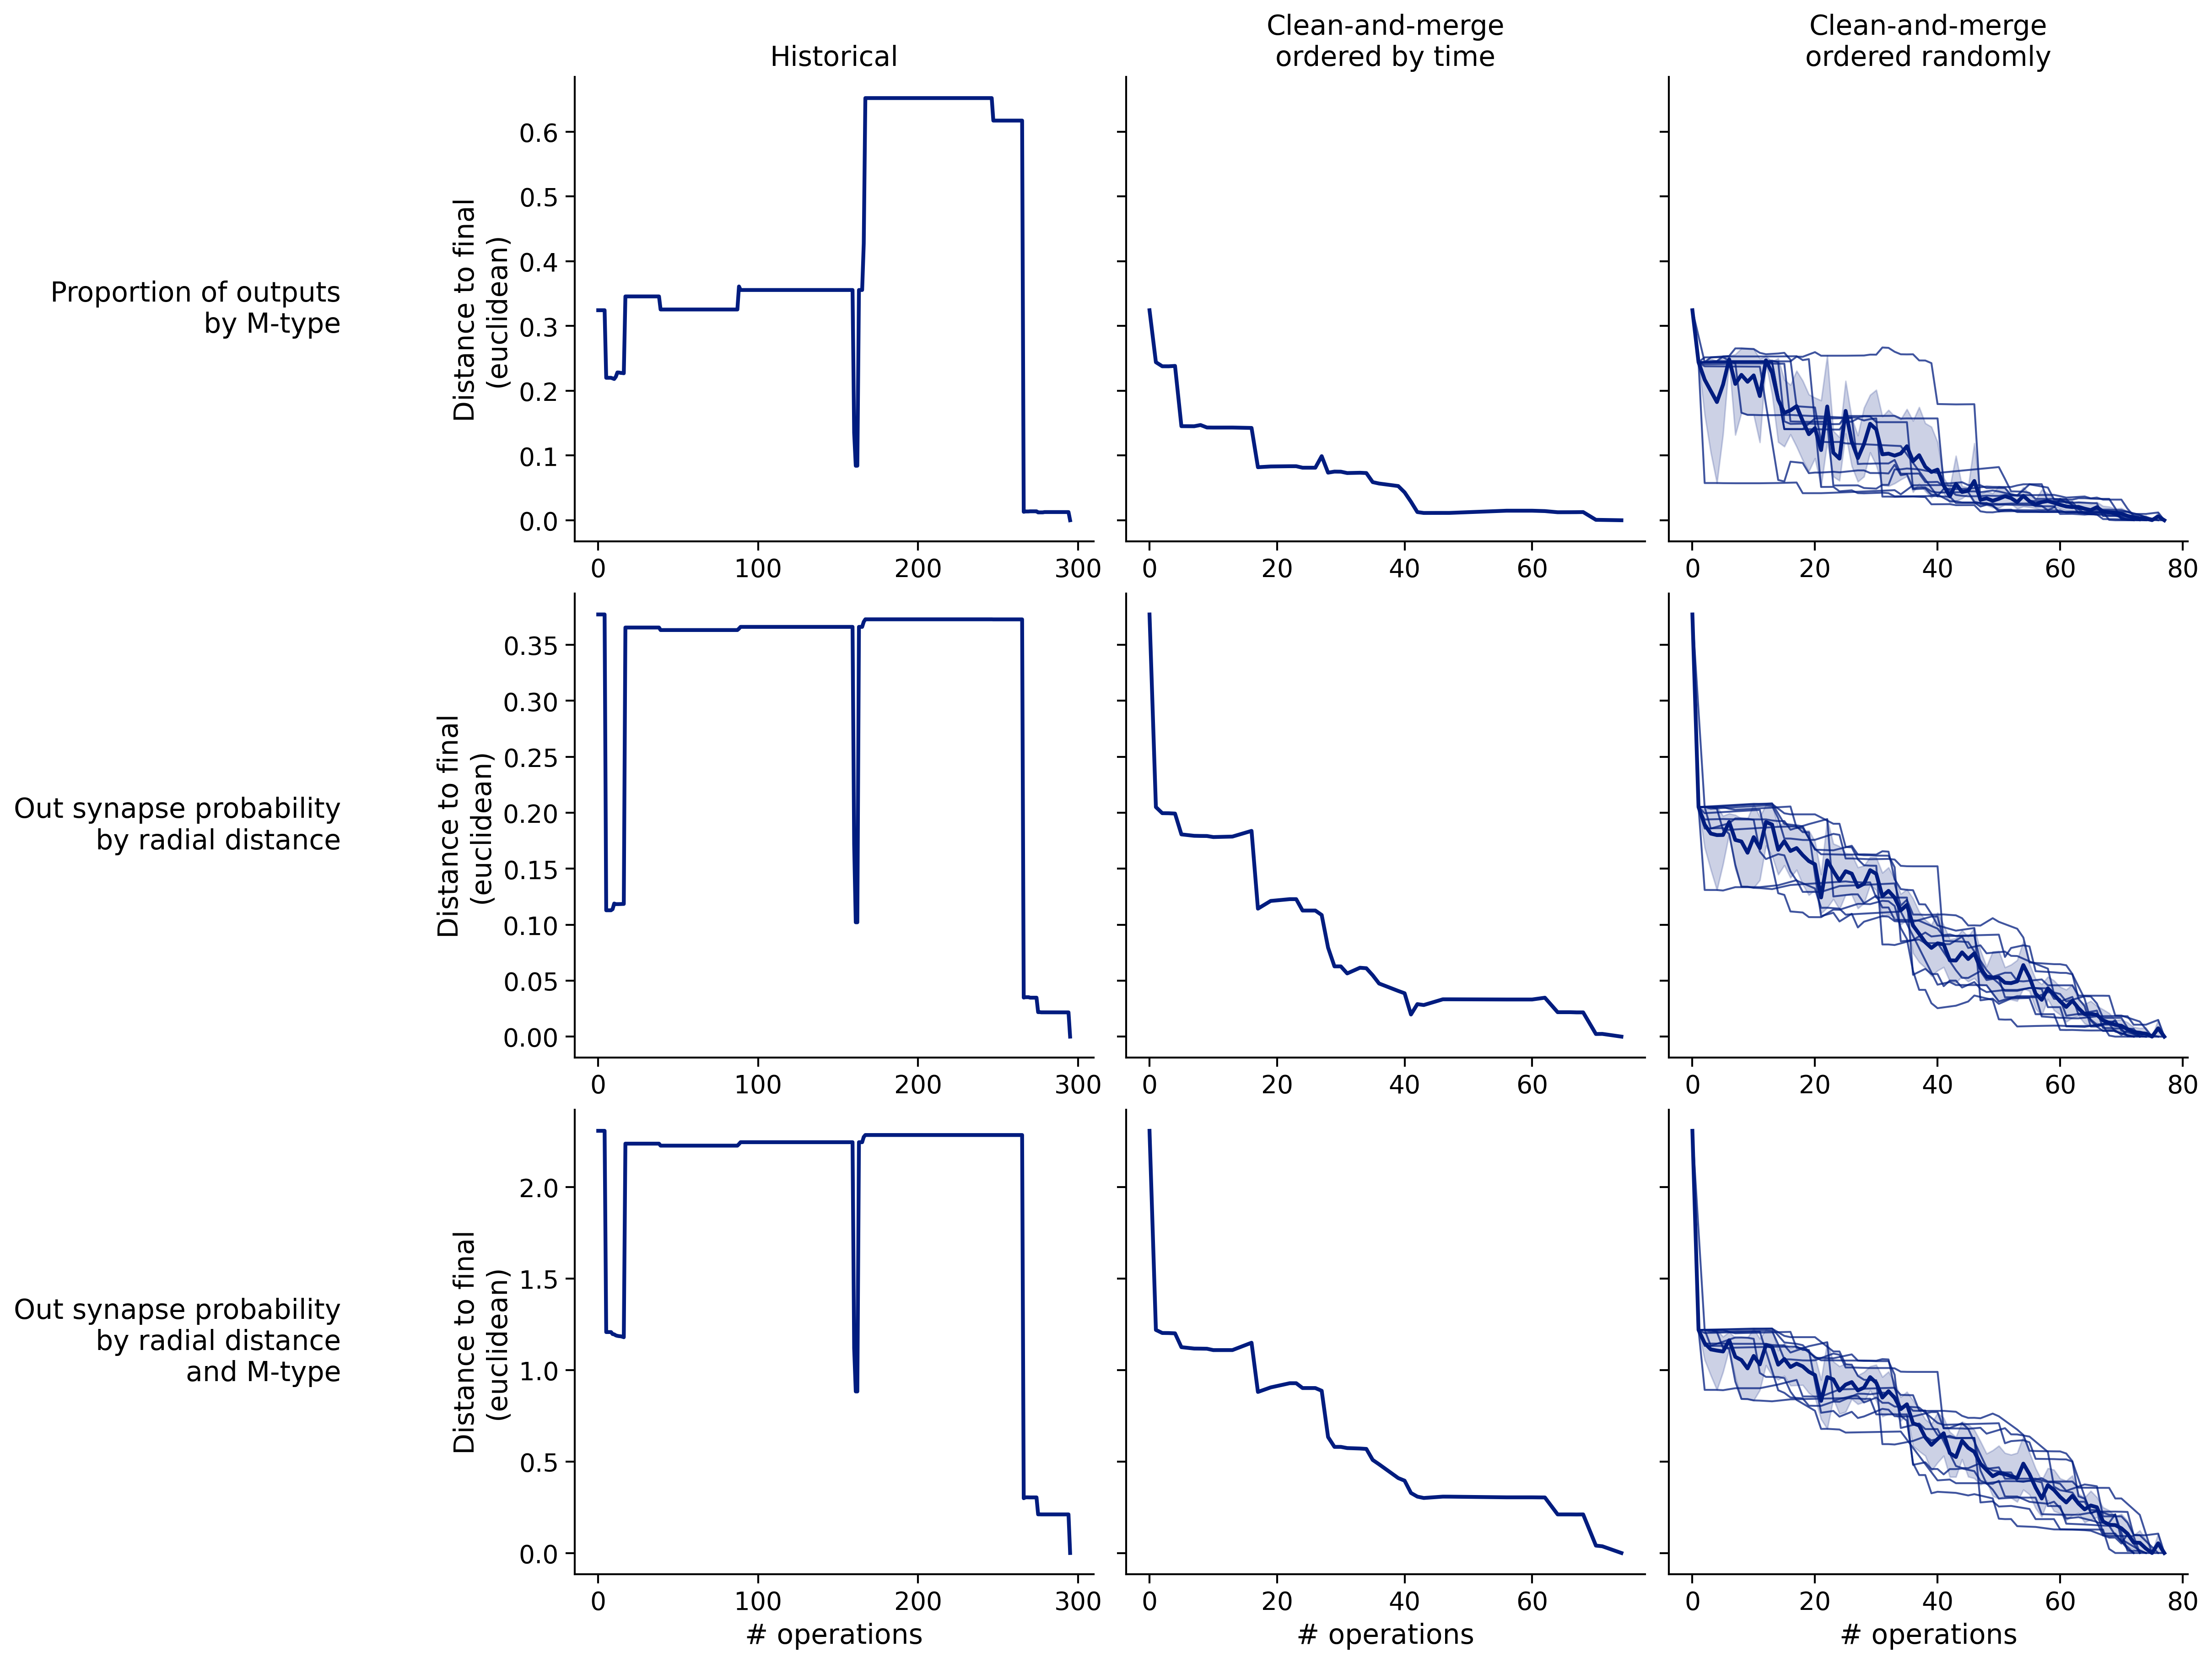
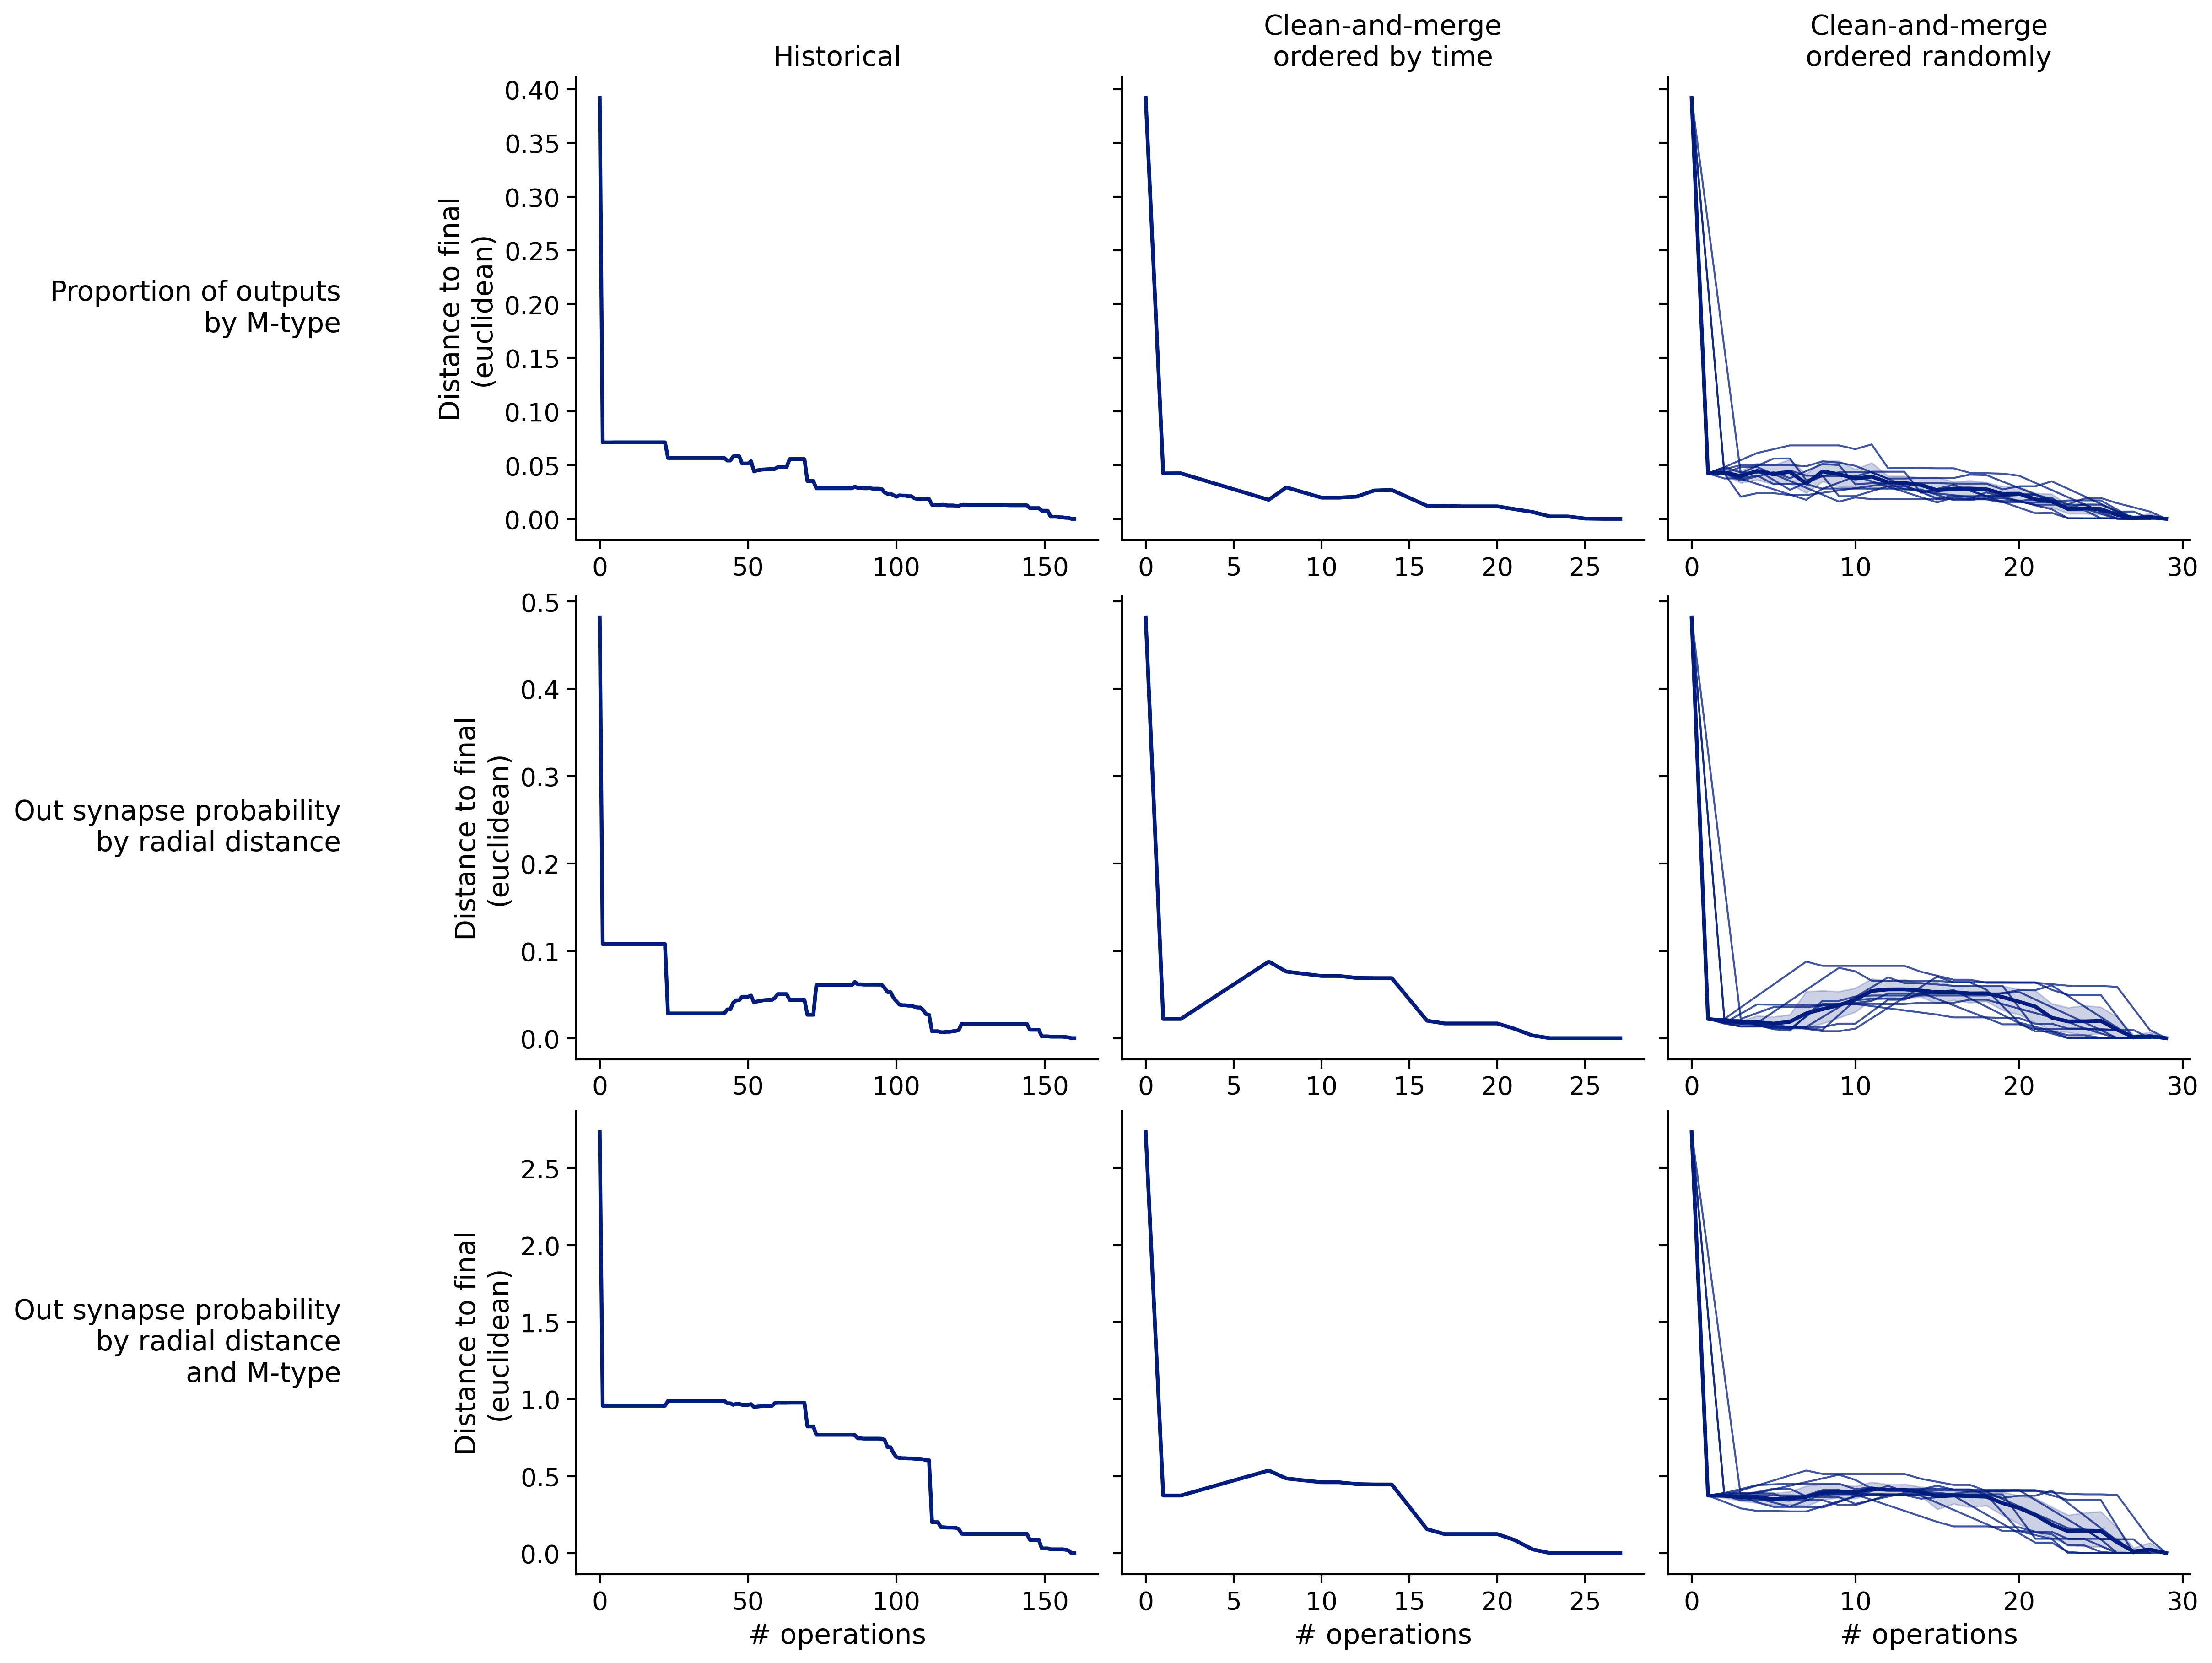
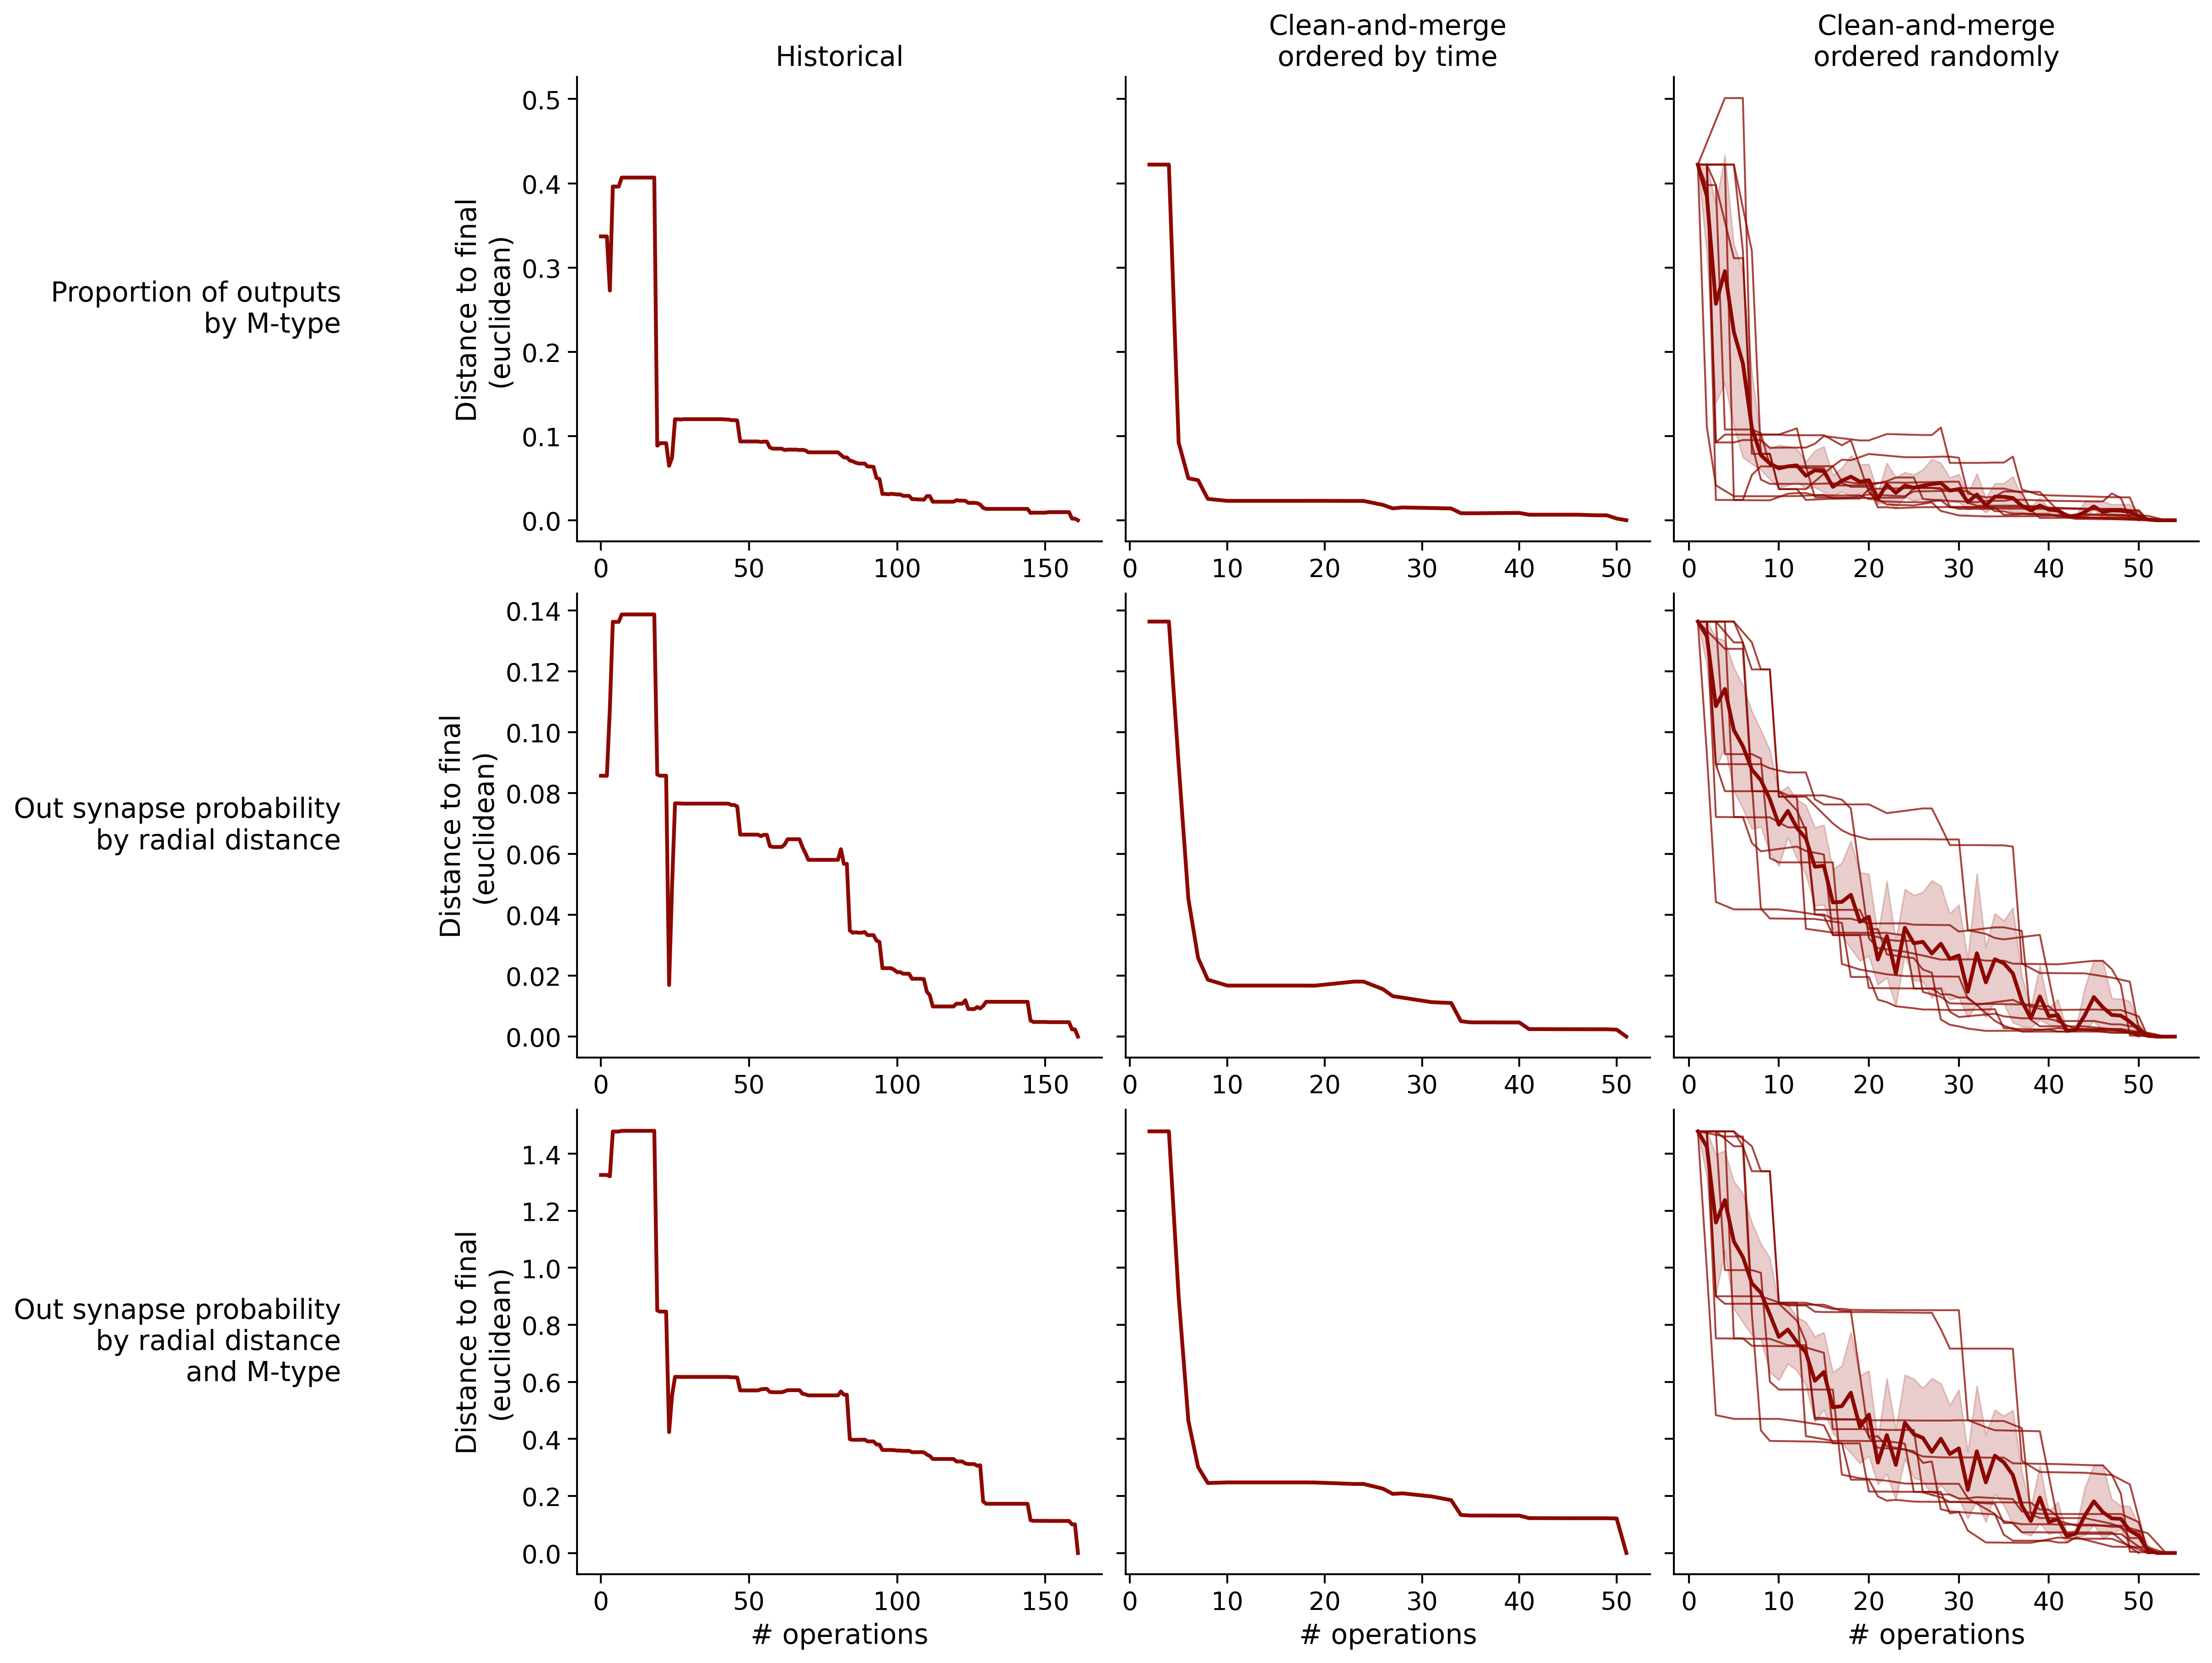
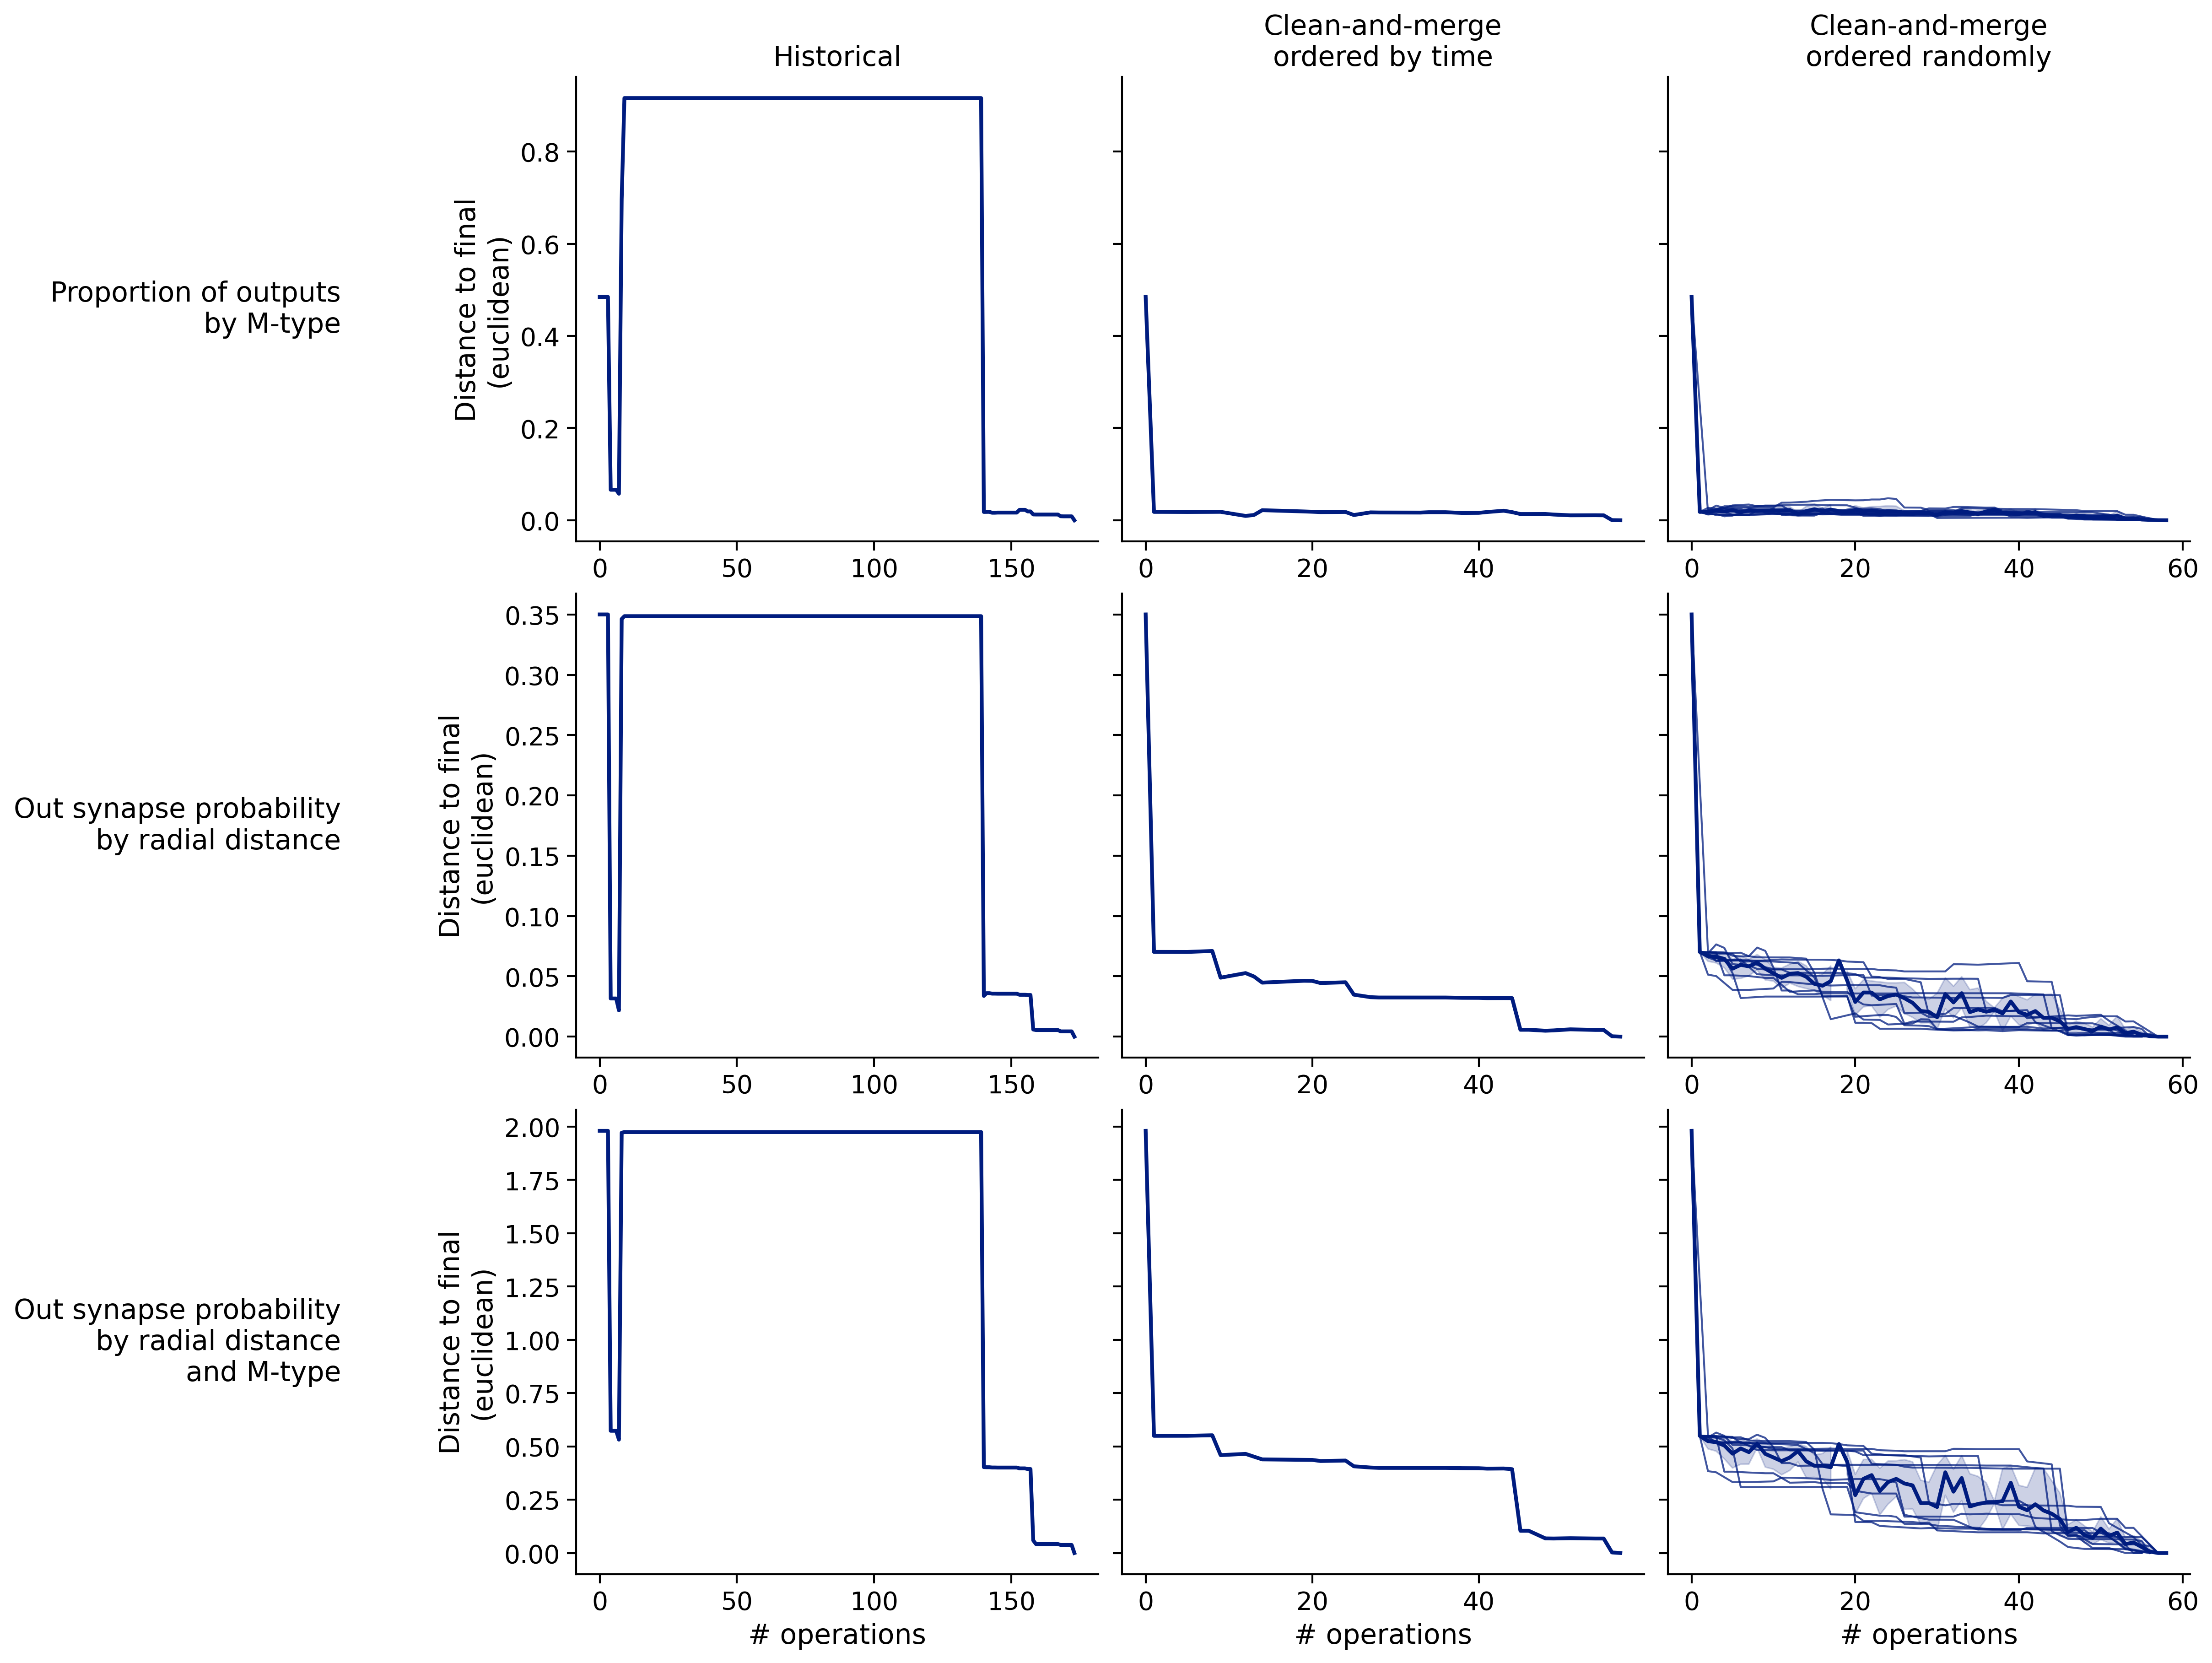
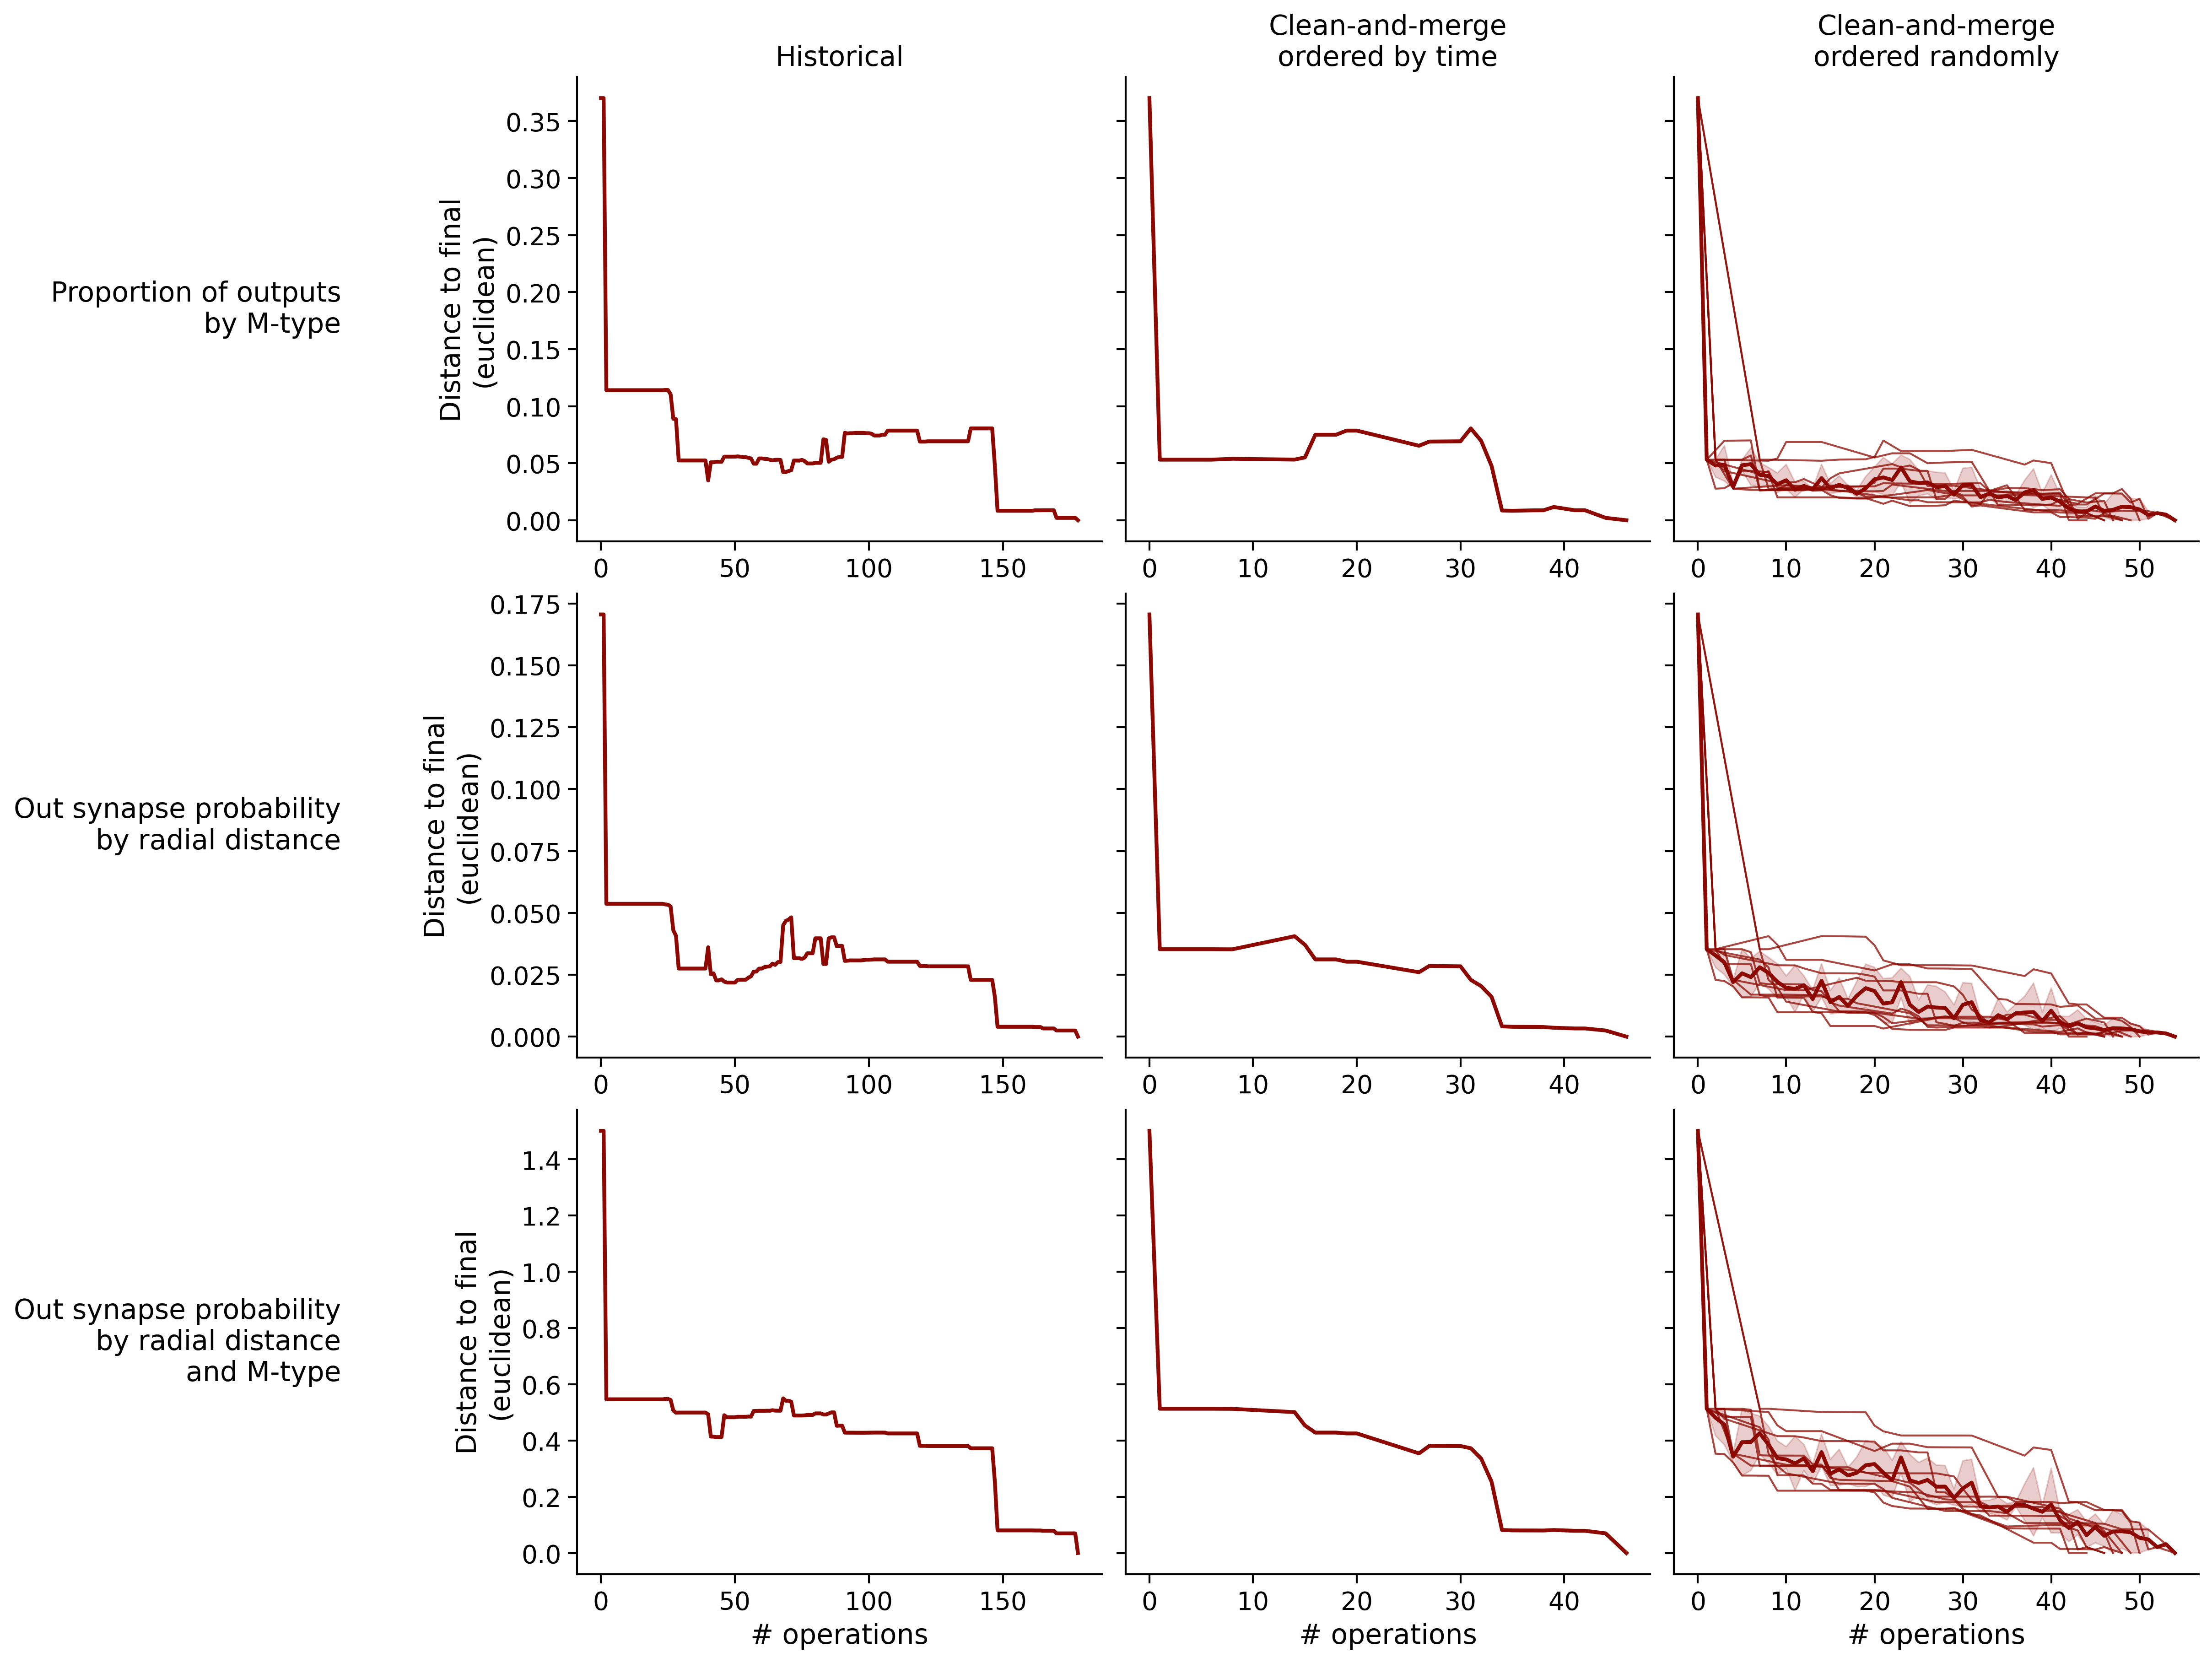
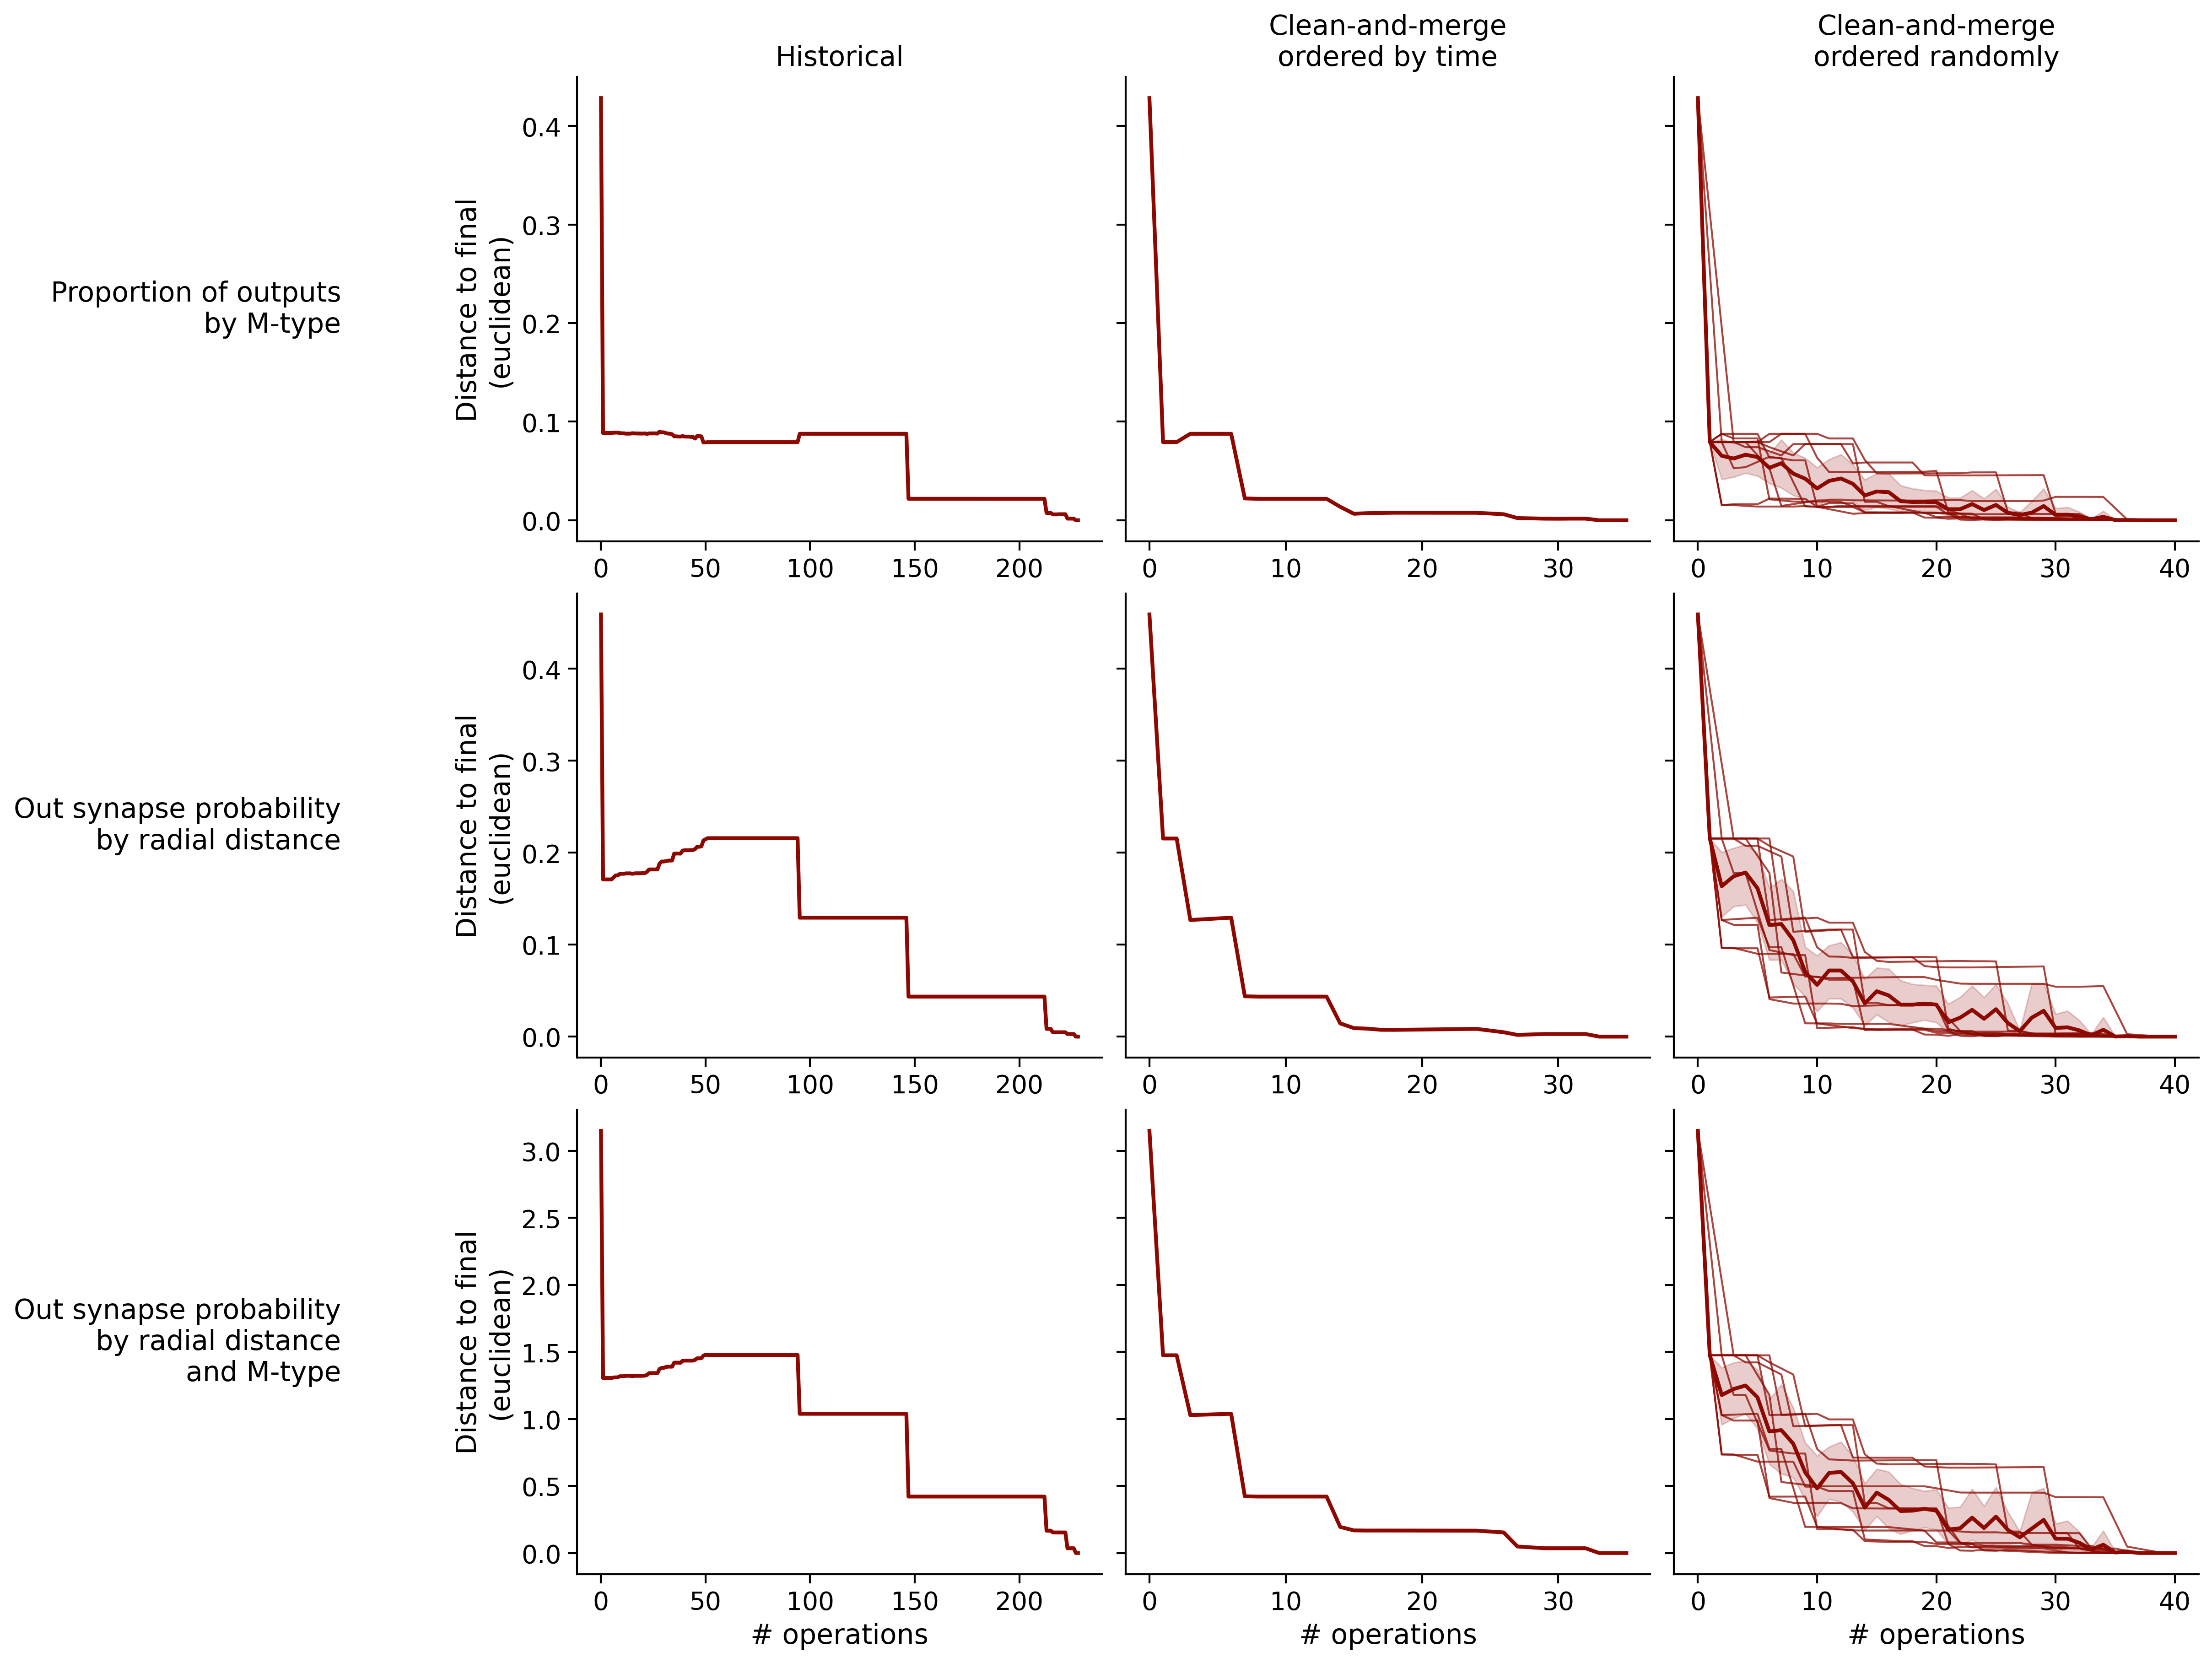
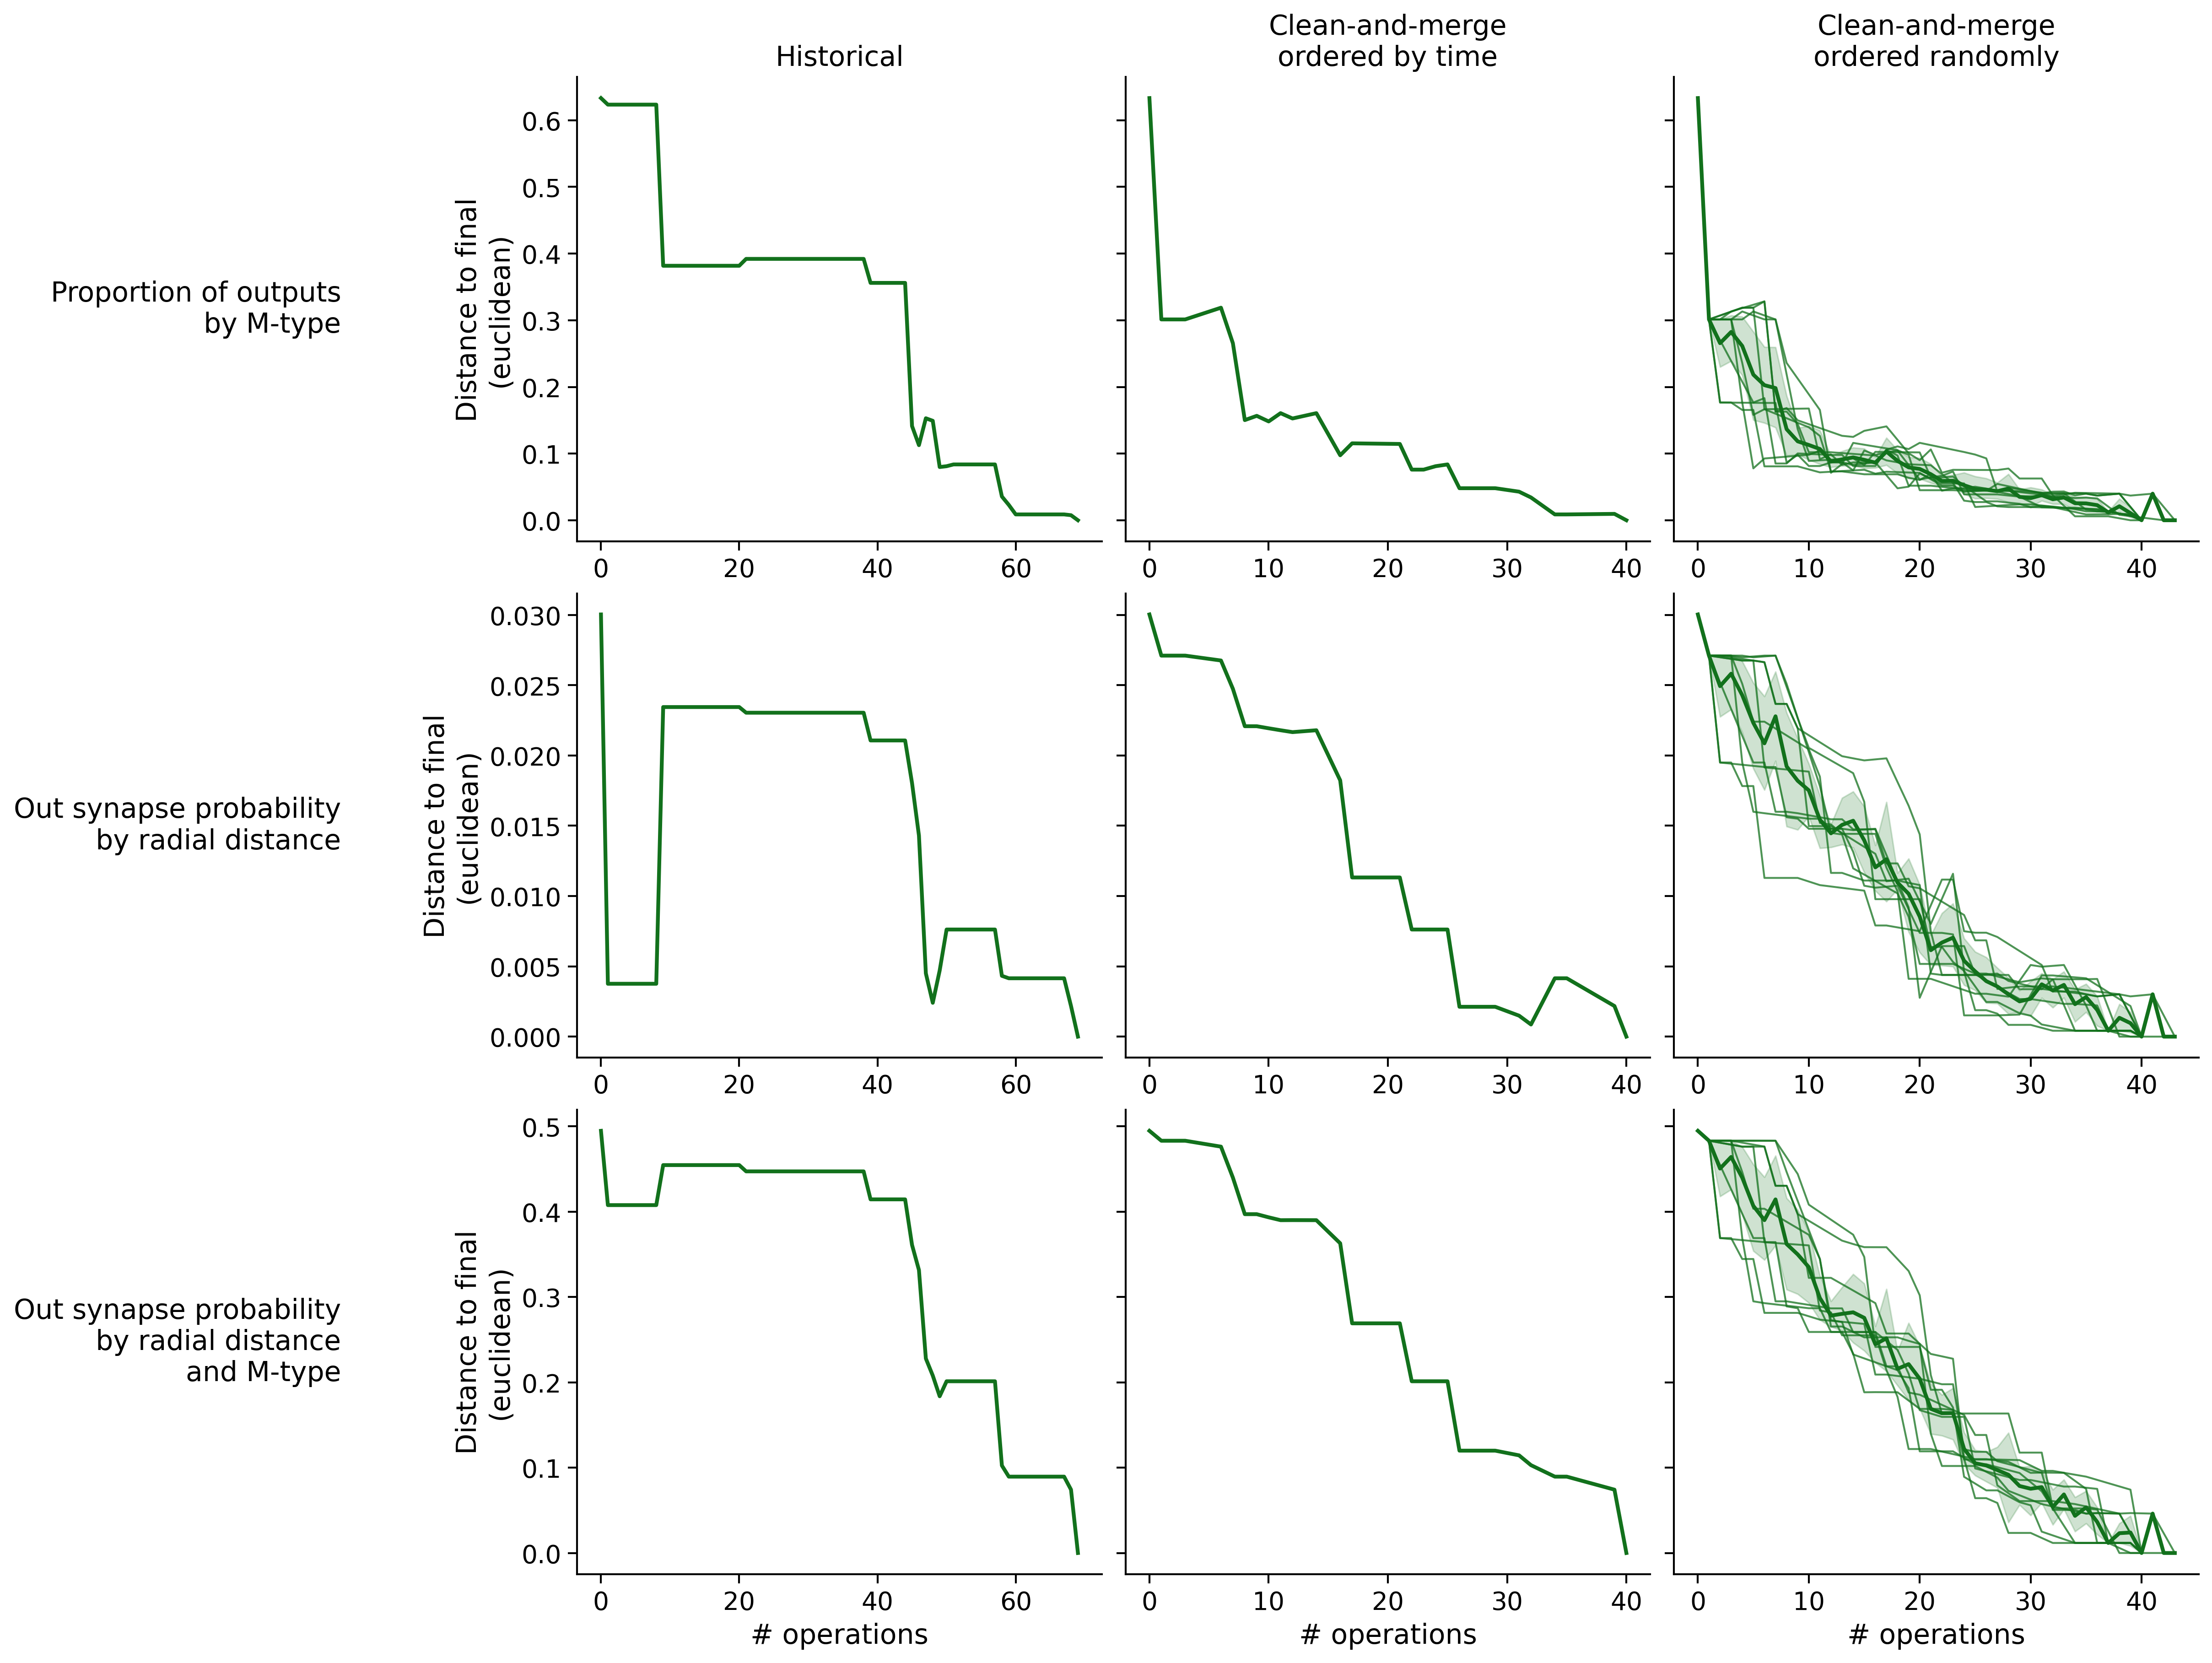
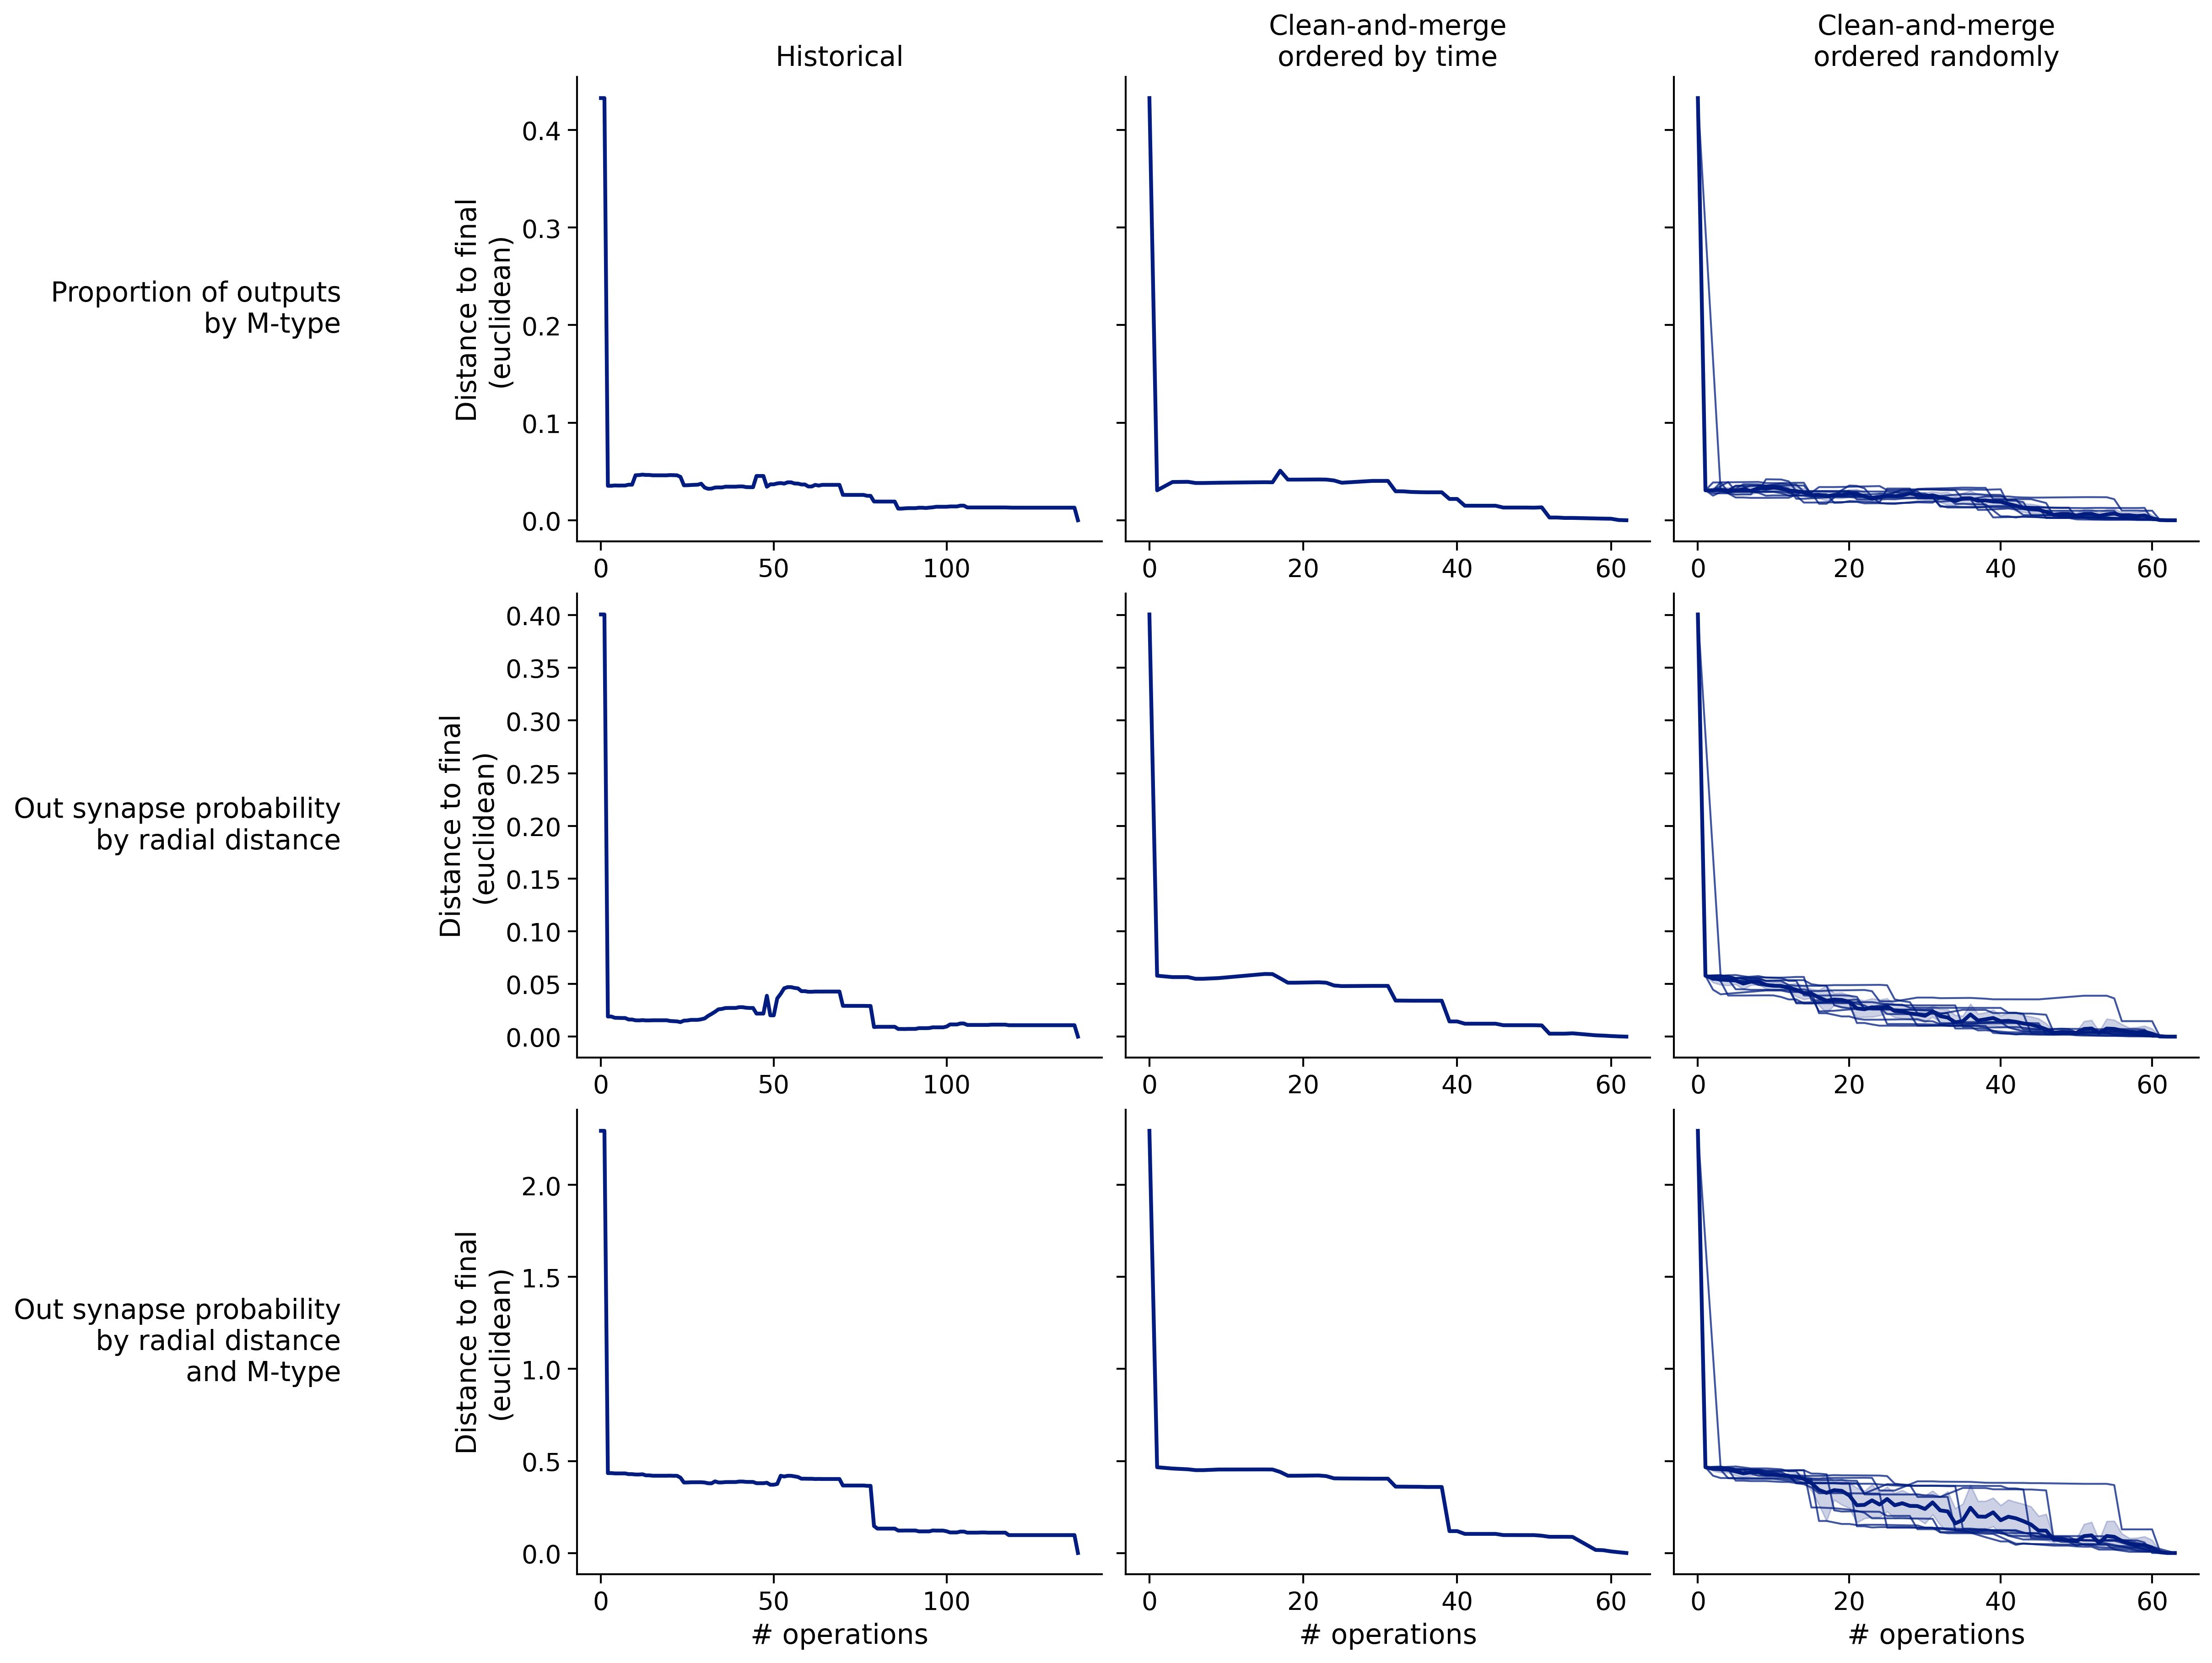
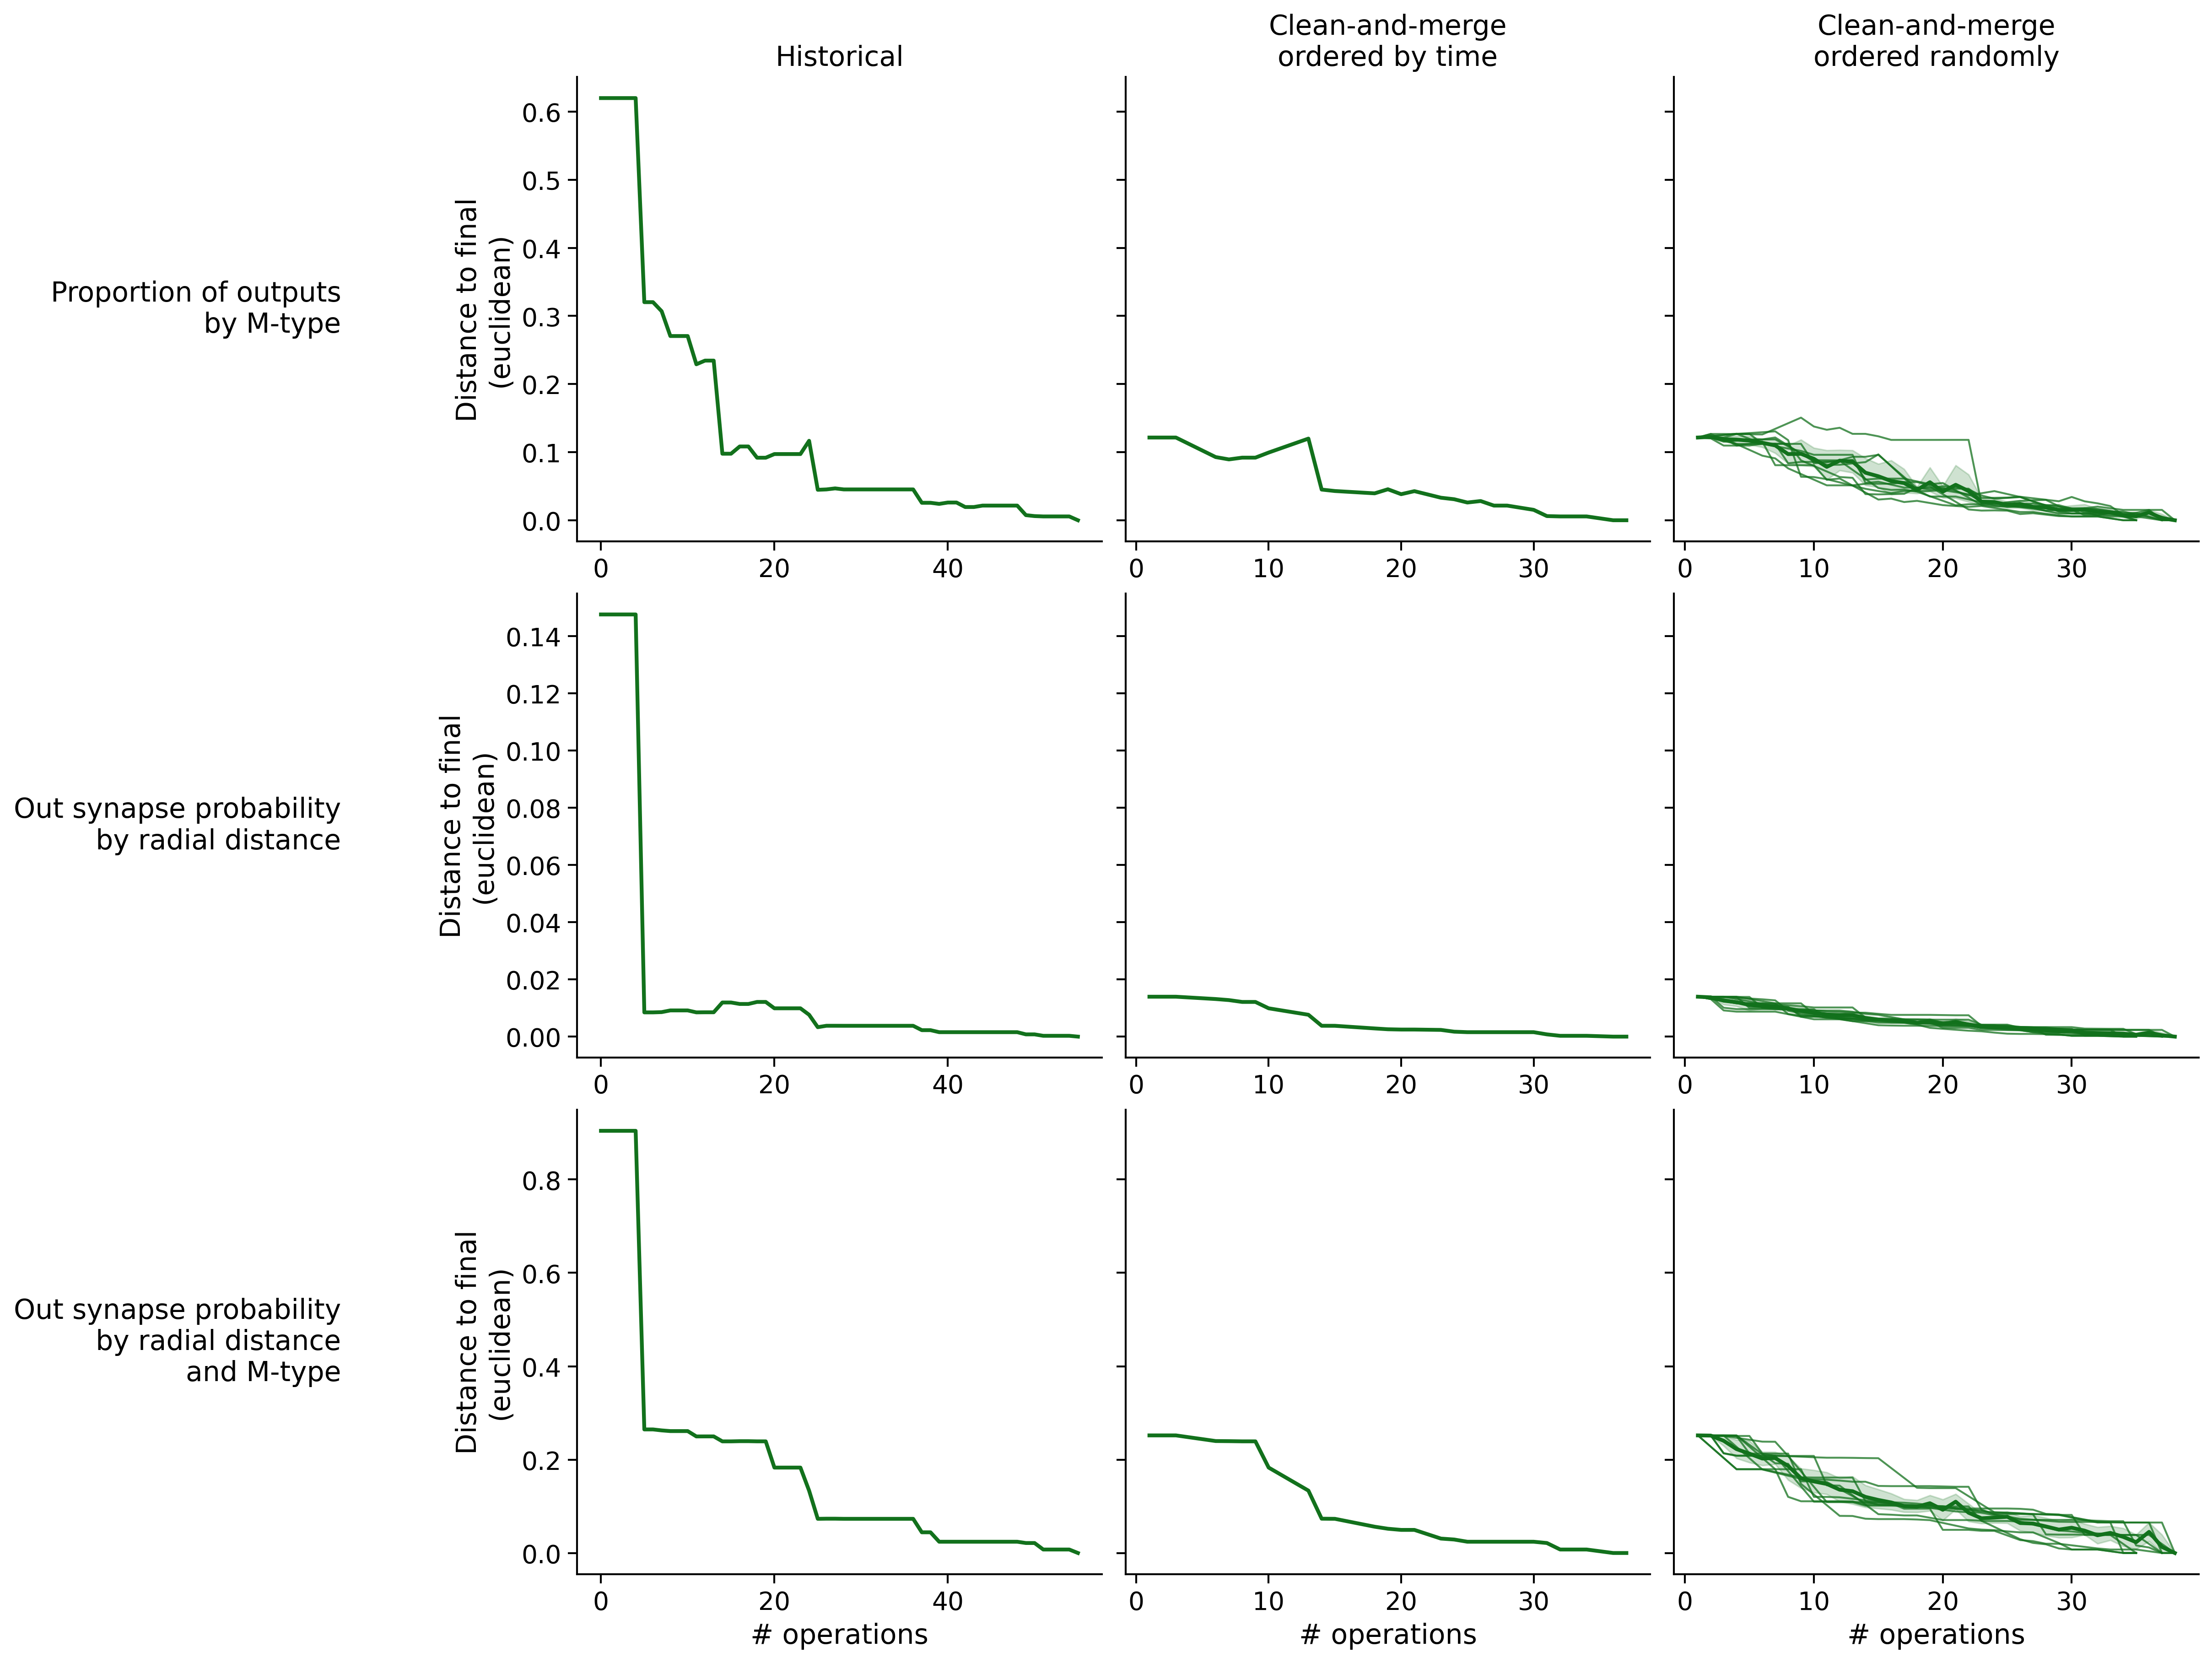
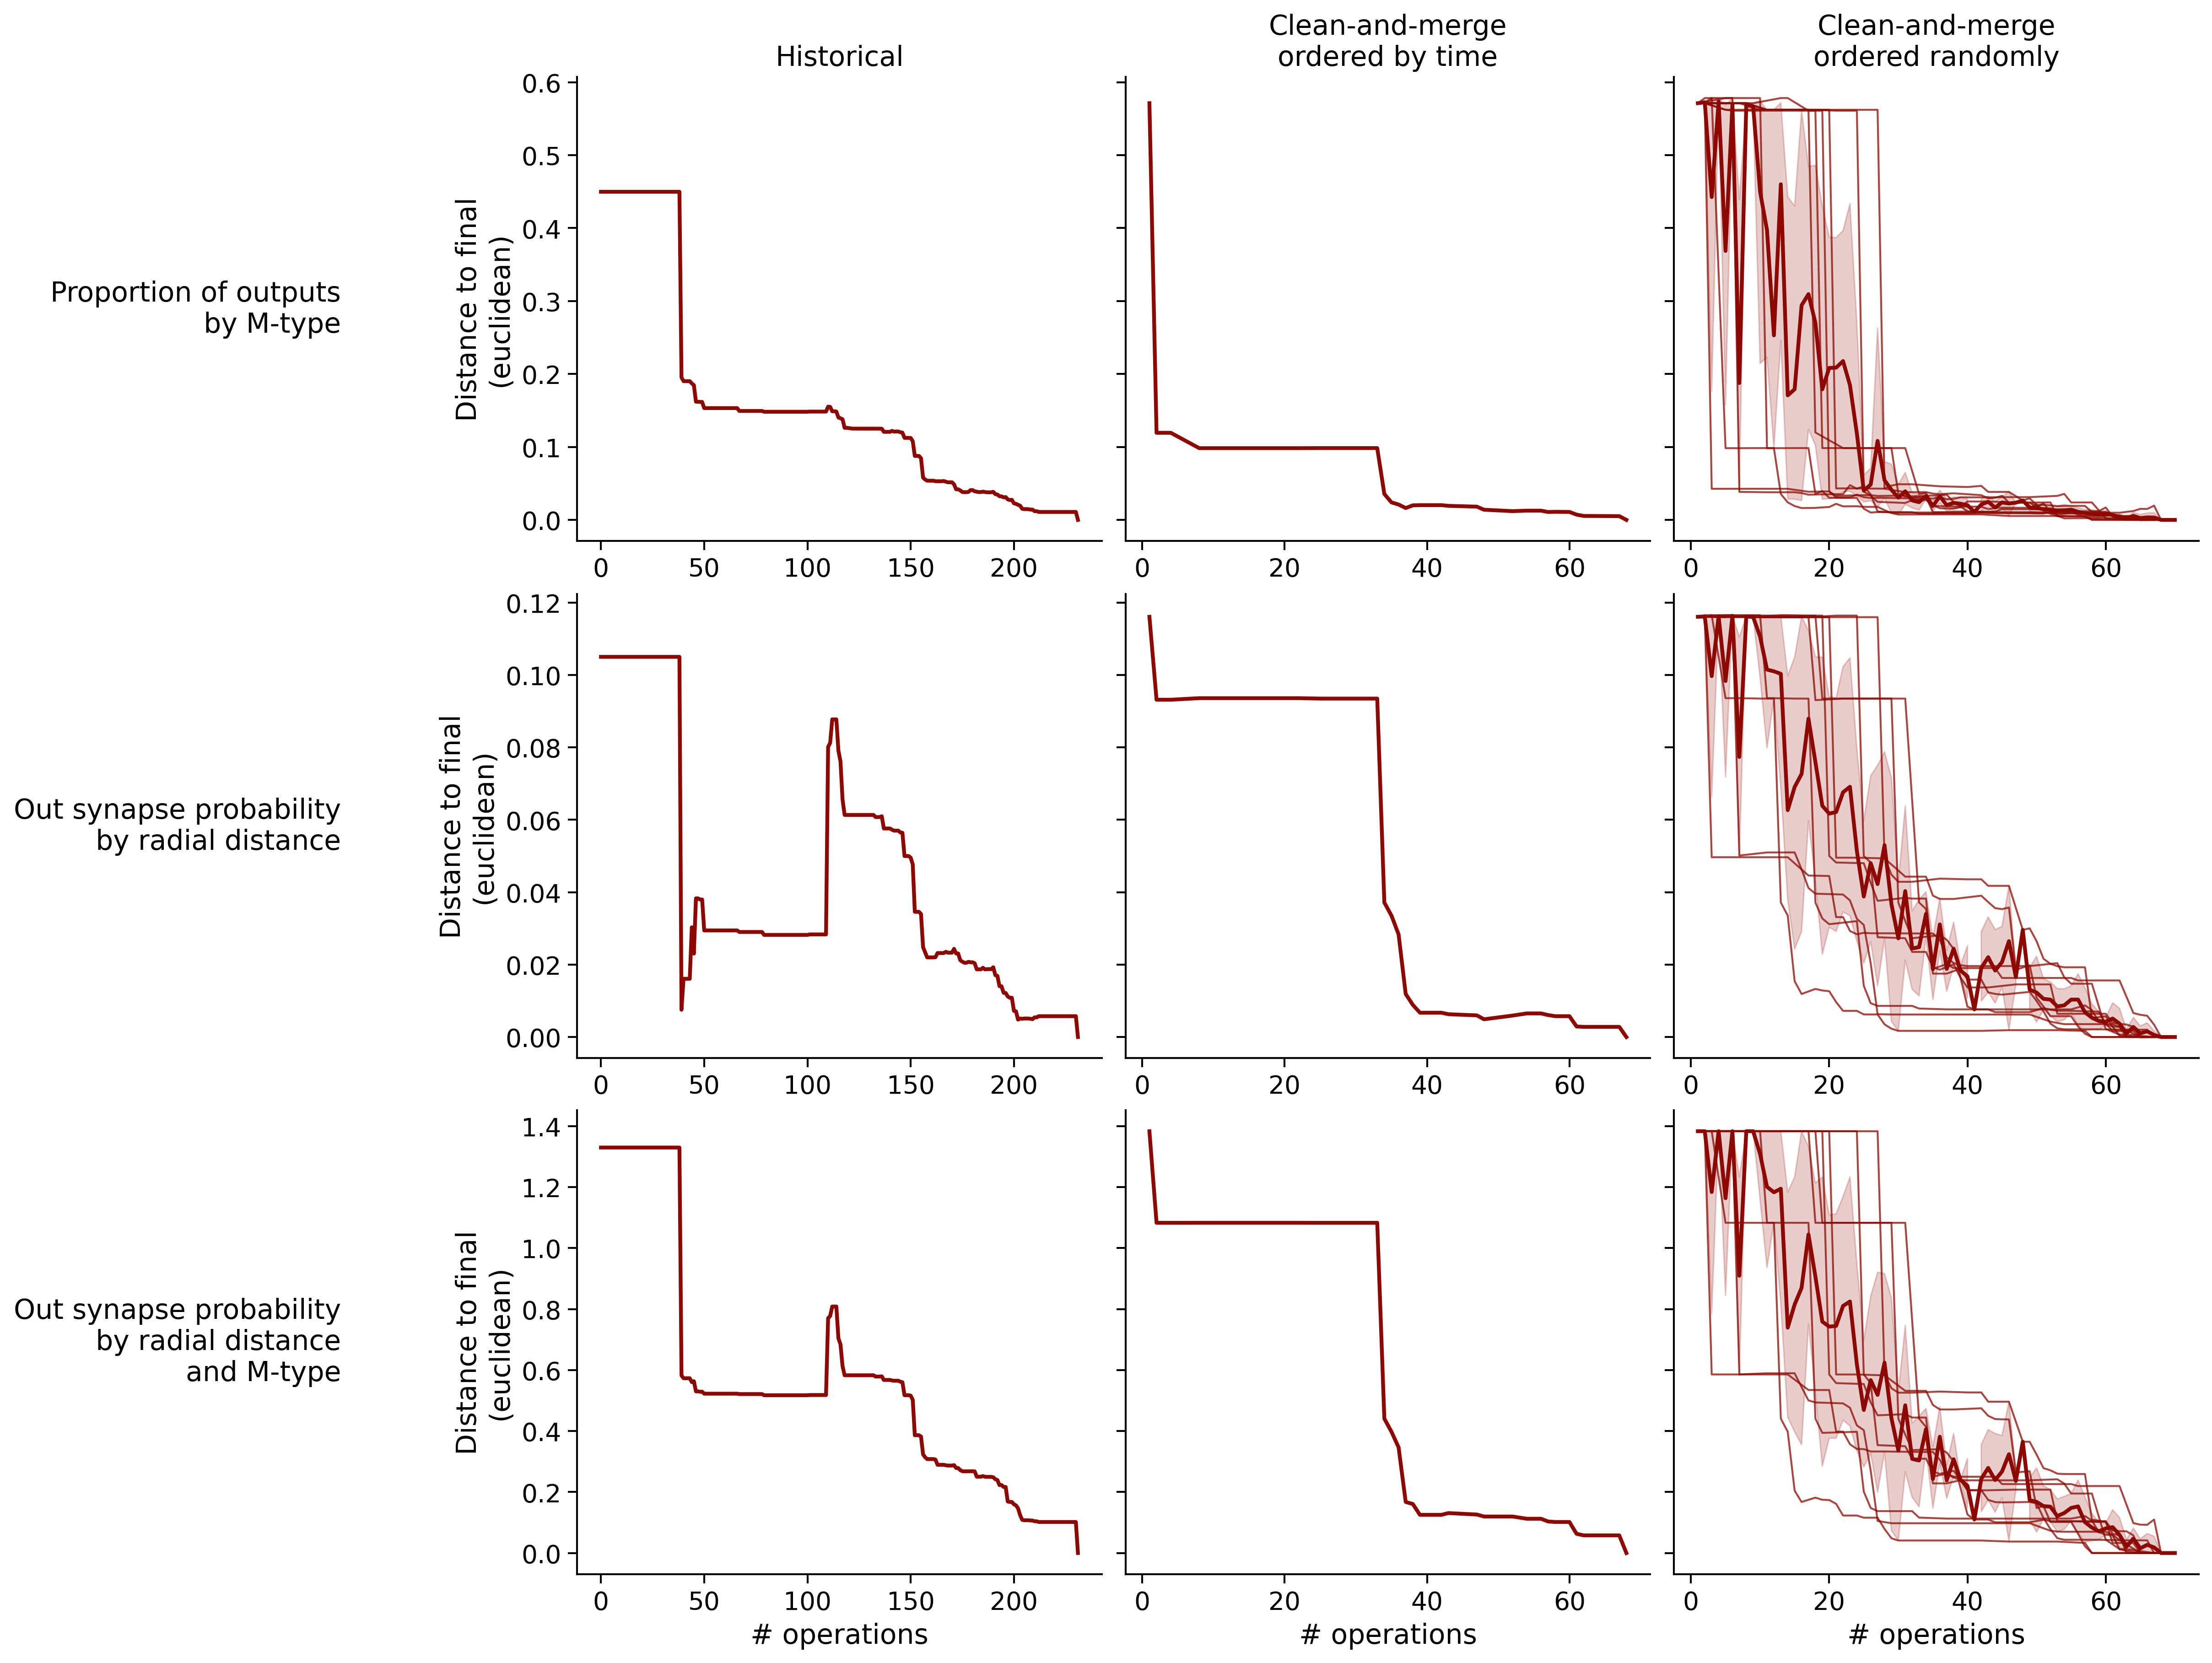
Feature distances from final
To simplify things, we can consider these features in terms of how similar they are to that feature computed at the end of proofreading.
Math
Let \(x_i\) be the feature for a given neuron at time index \(i\), and let \(x_{final}\) be defined similarly for the final state of the neuron after every proofreading edit has been applied. Now, we can compute
\[d_i = d(x_i, x_{final})\]
where \(d(., .)\) is some suitable distance function/metric, for instance, euclidean distance, Jensen-Shannon divergence, etc.
TODO: Some kind of vertical histogram - just not sure what the normalization here should be
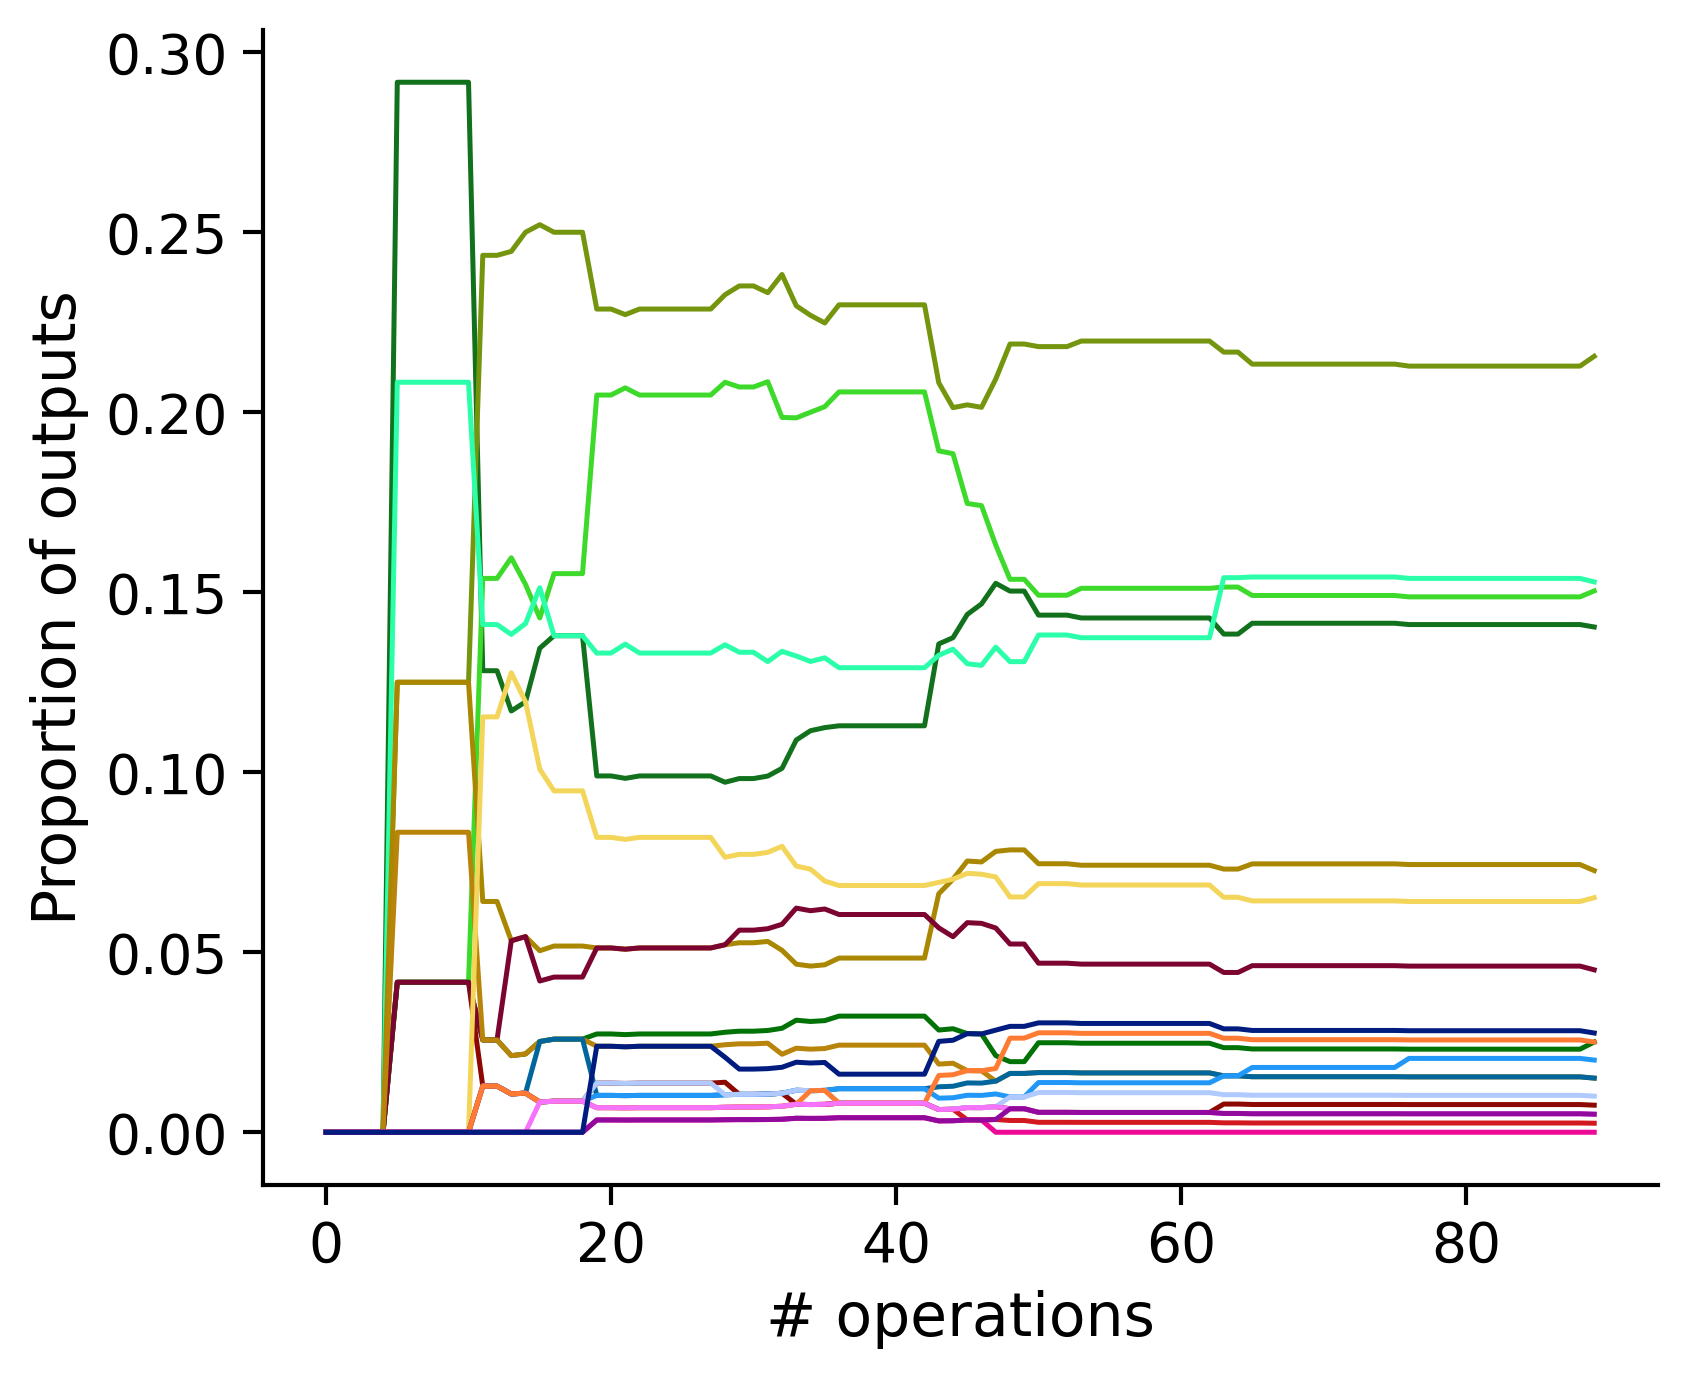
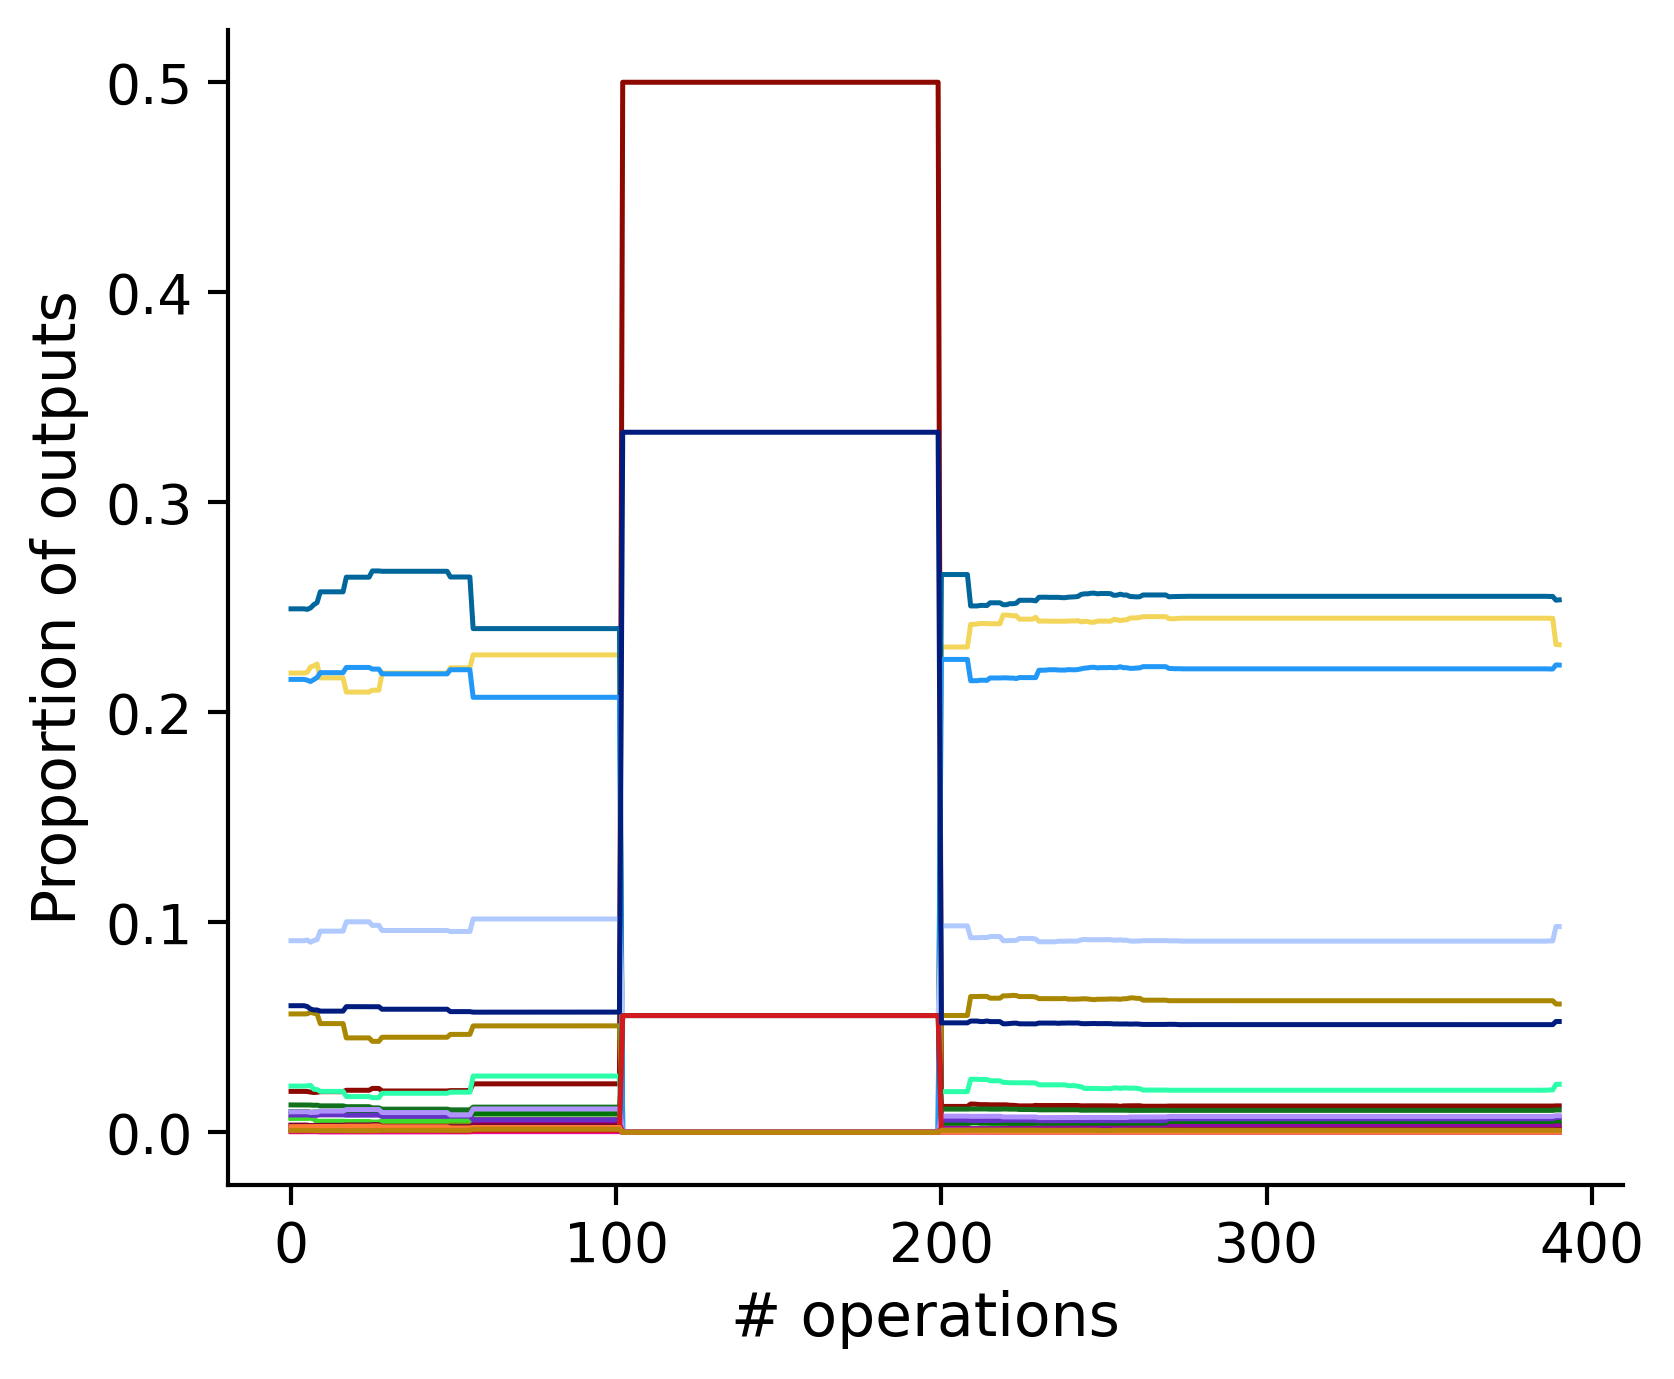
Clean-and-merge ordering
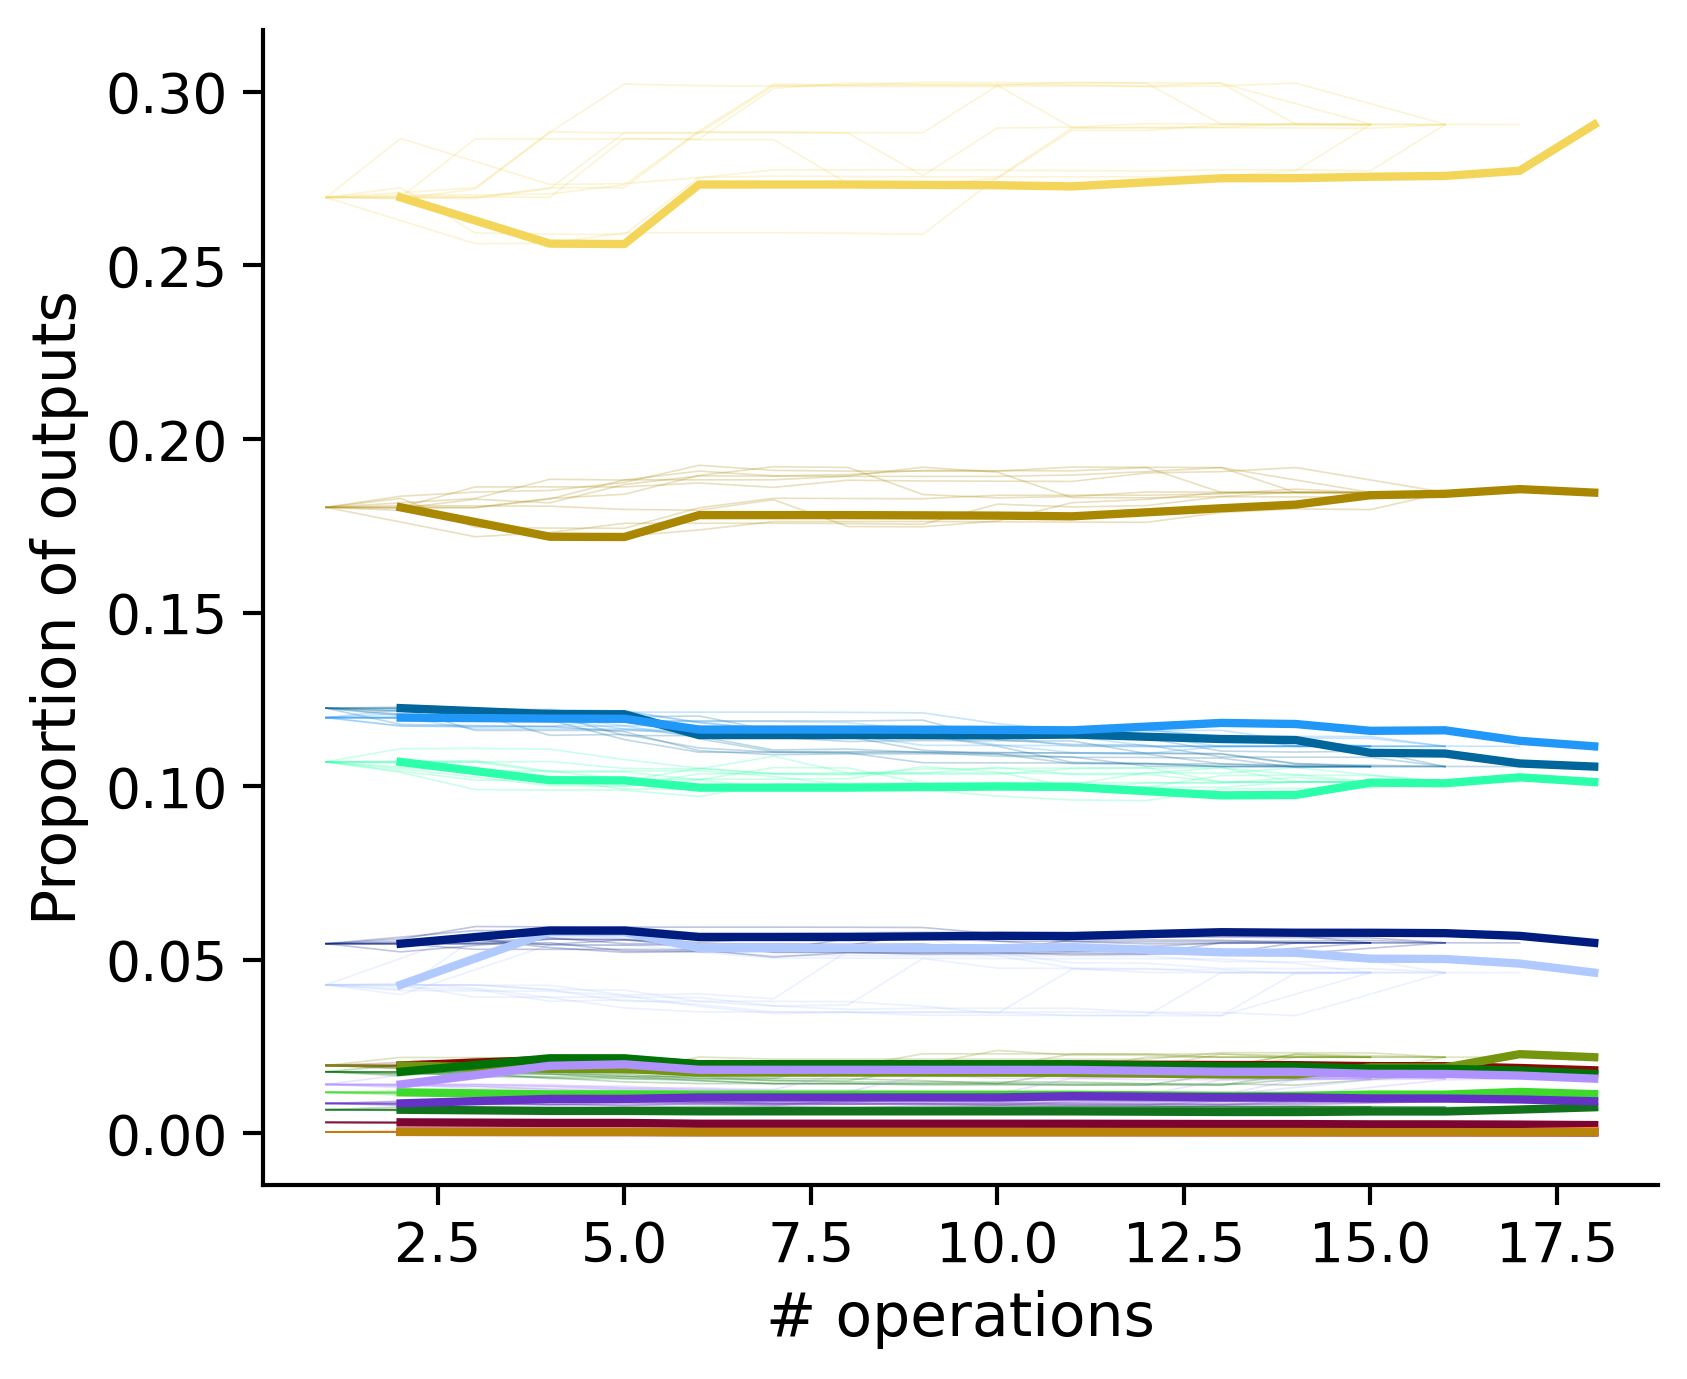
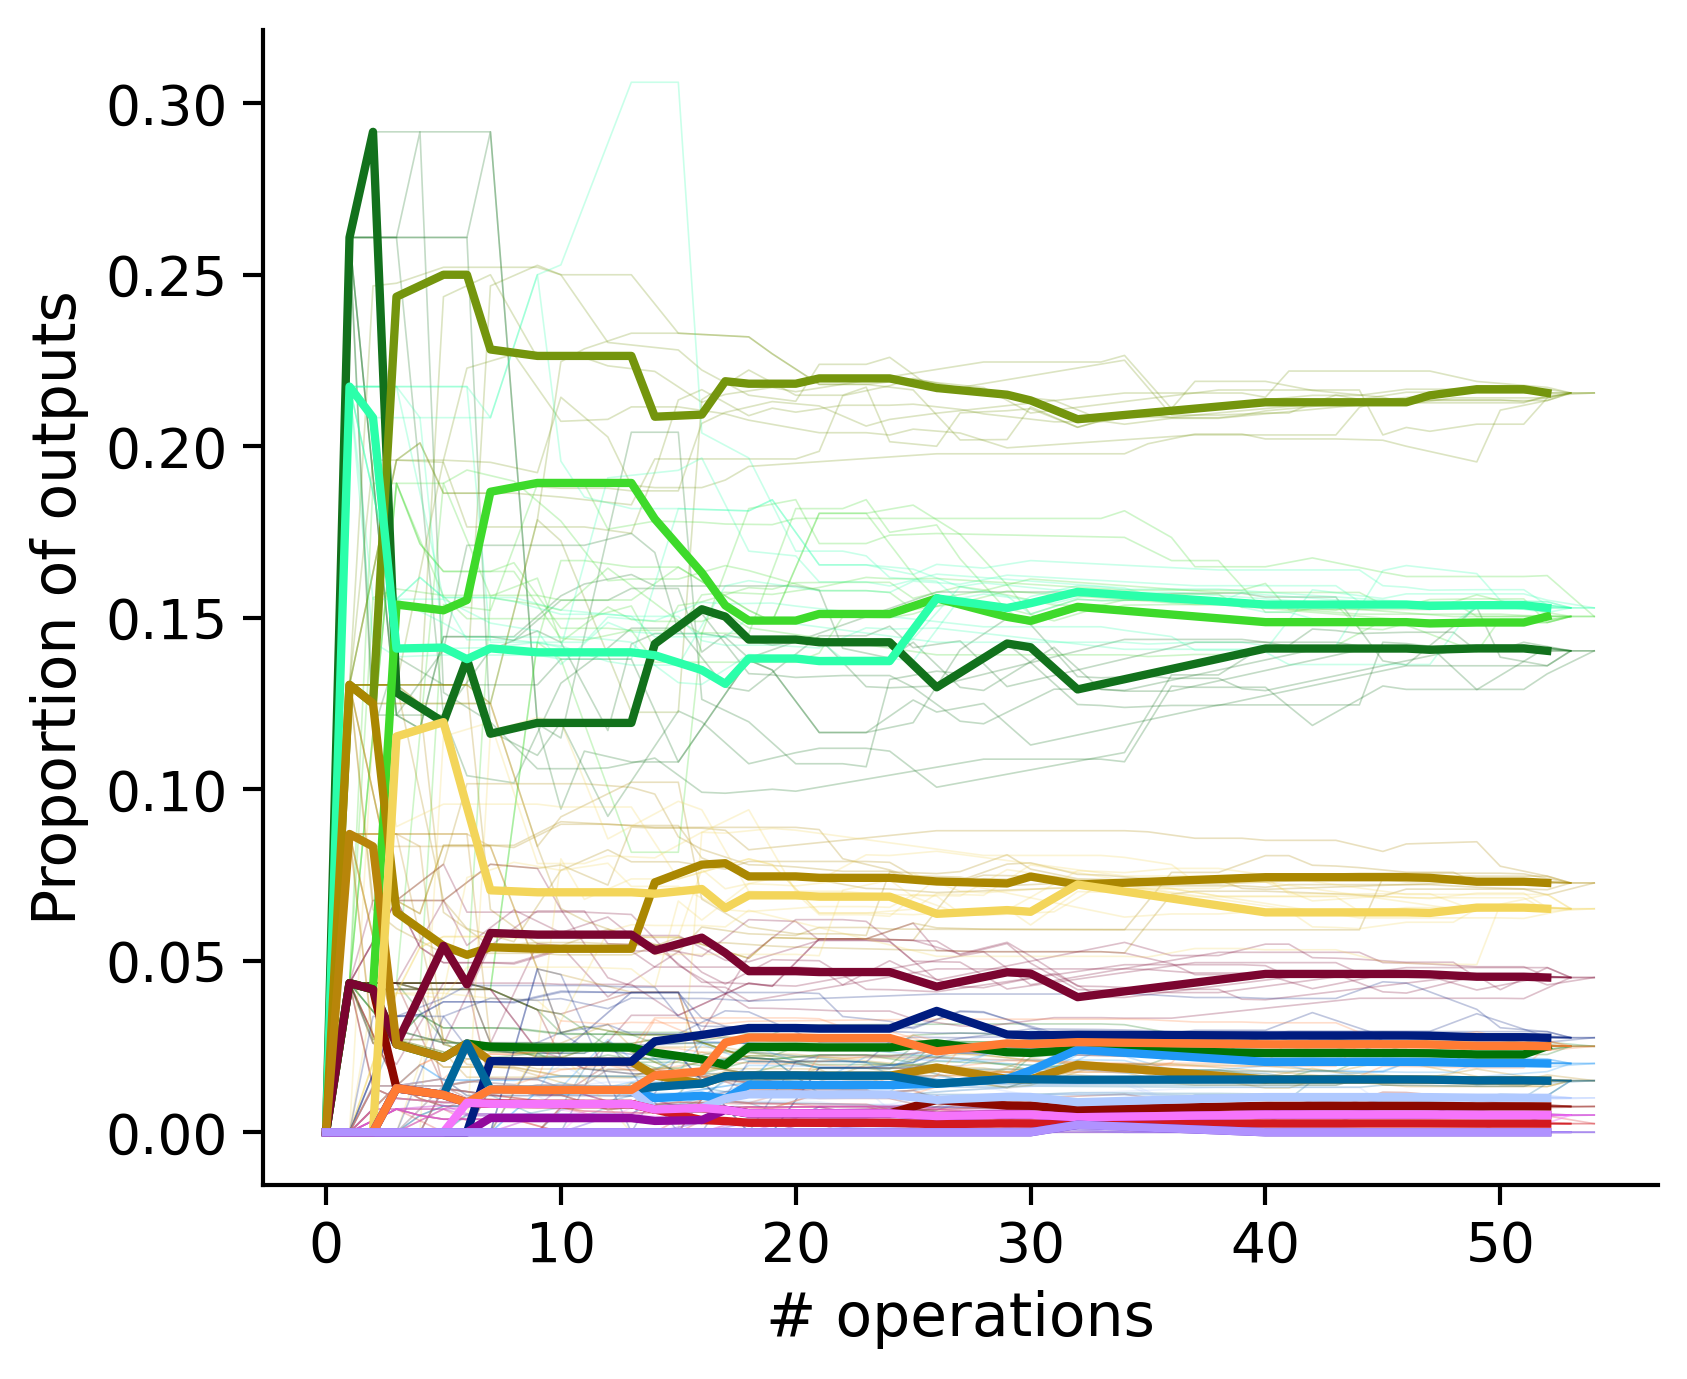
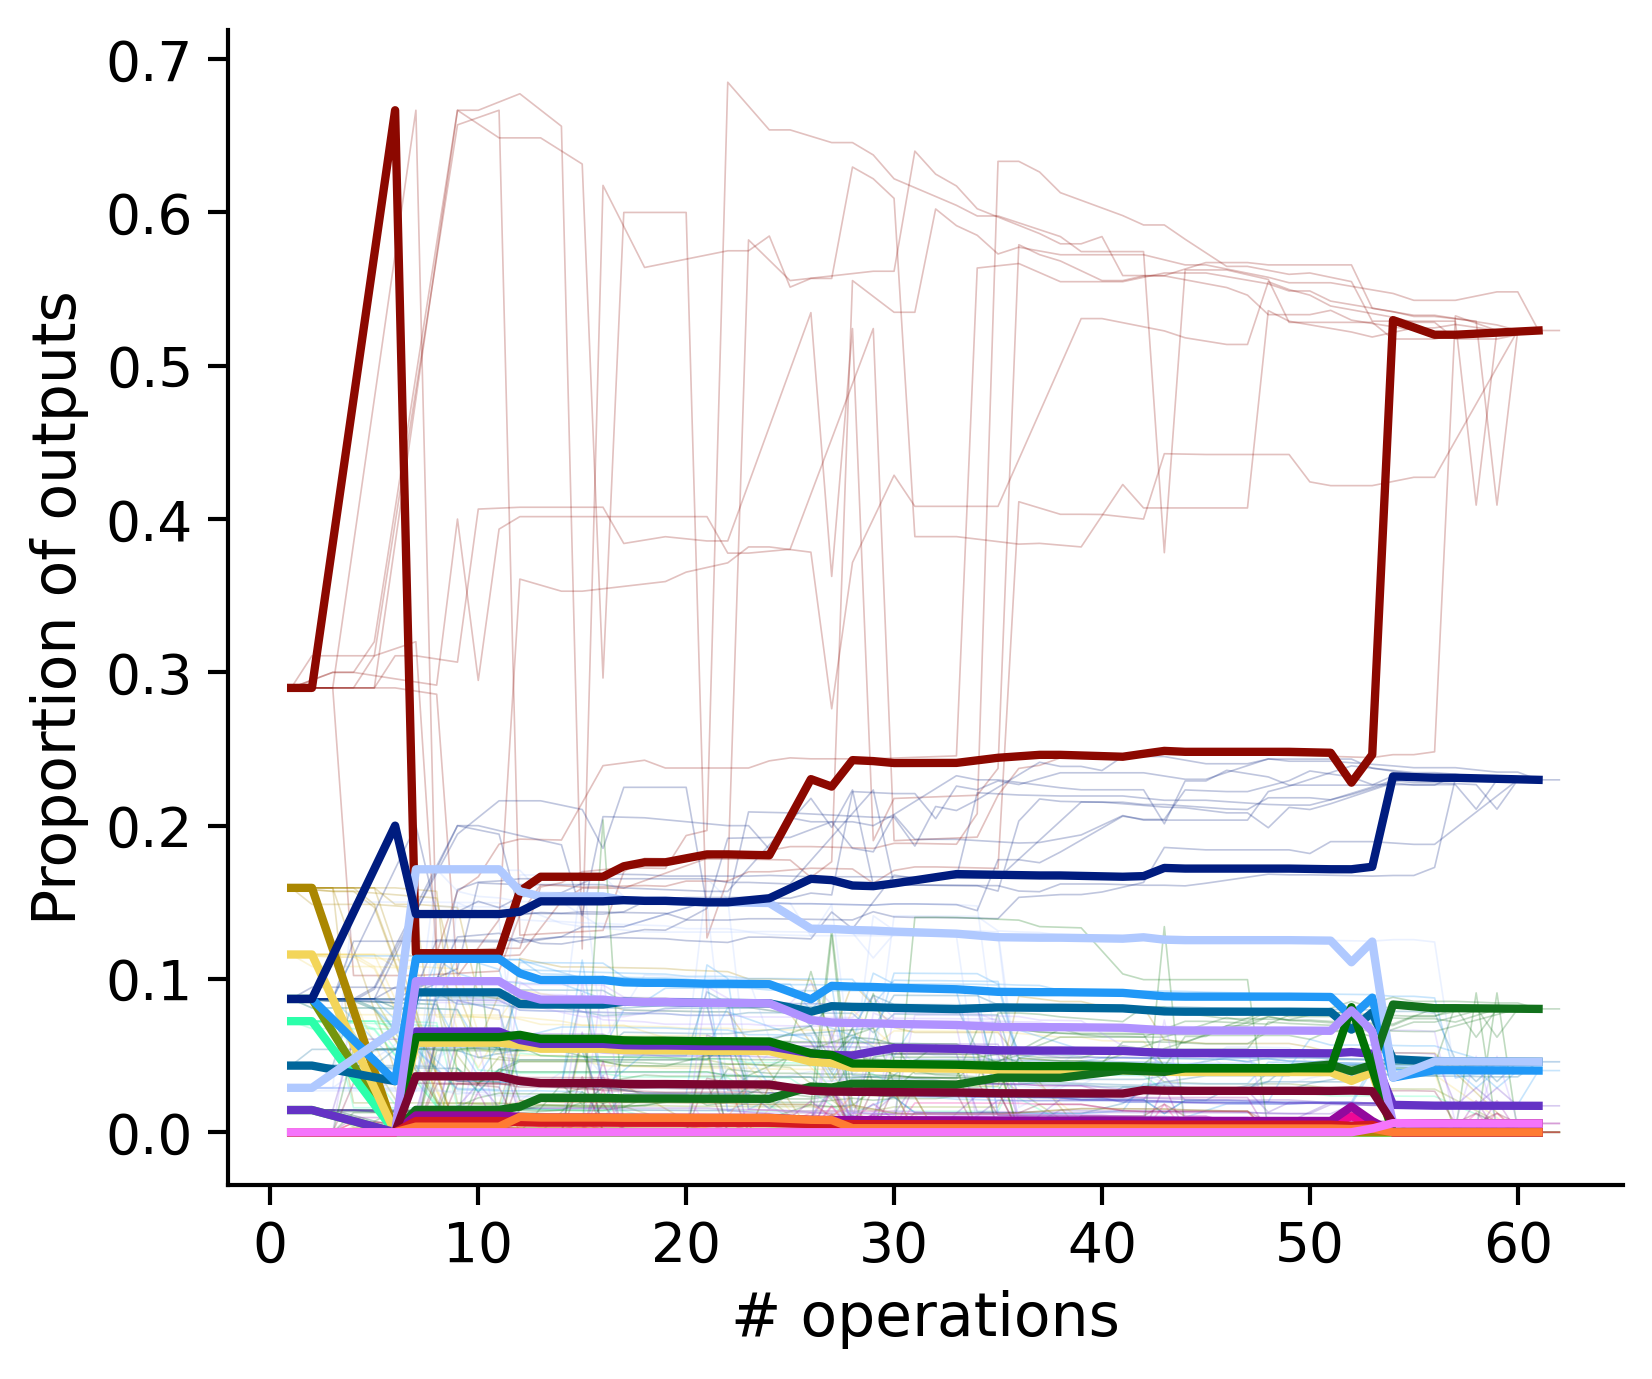
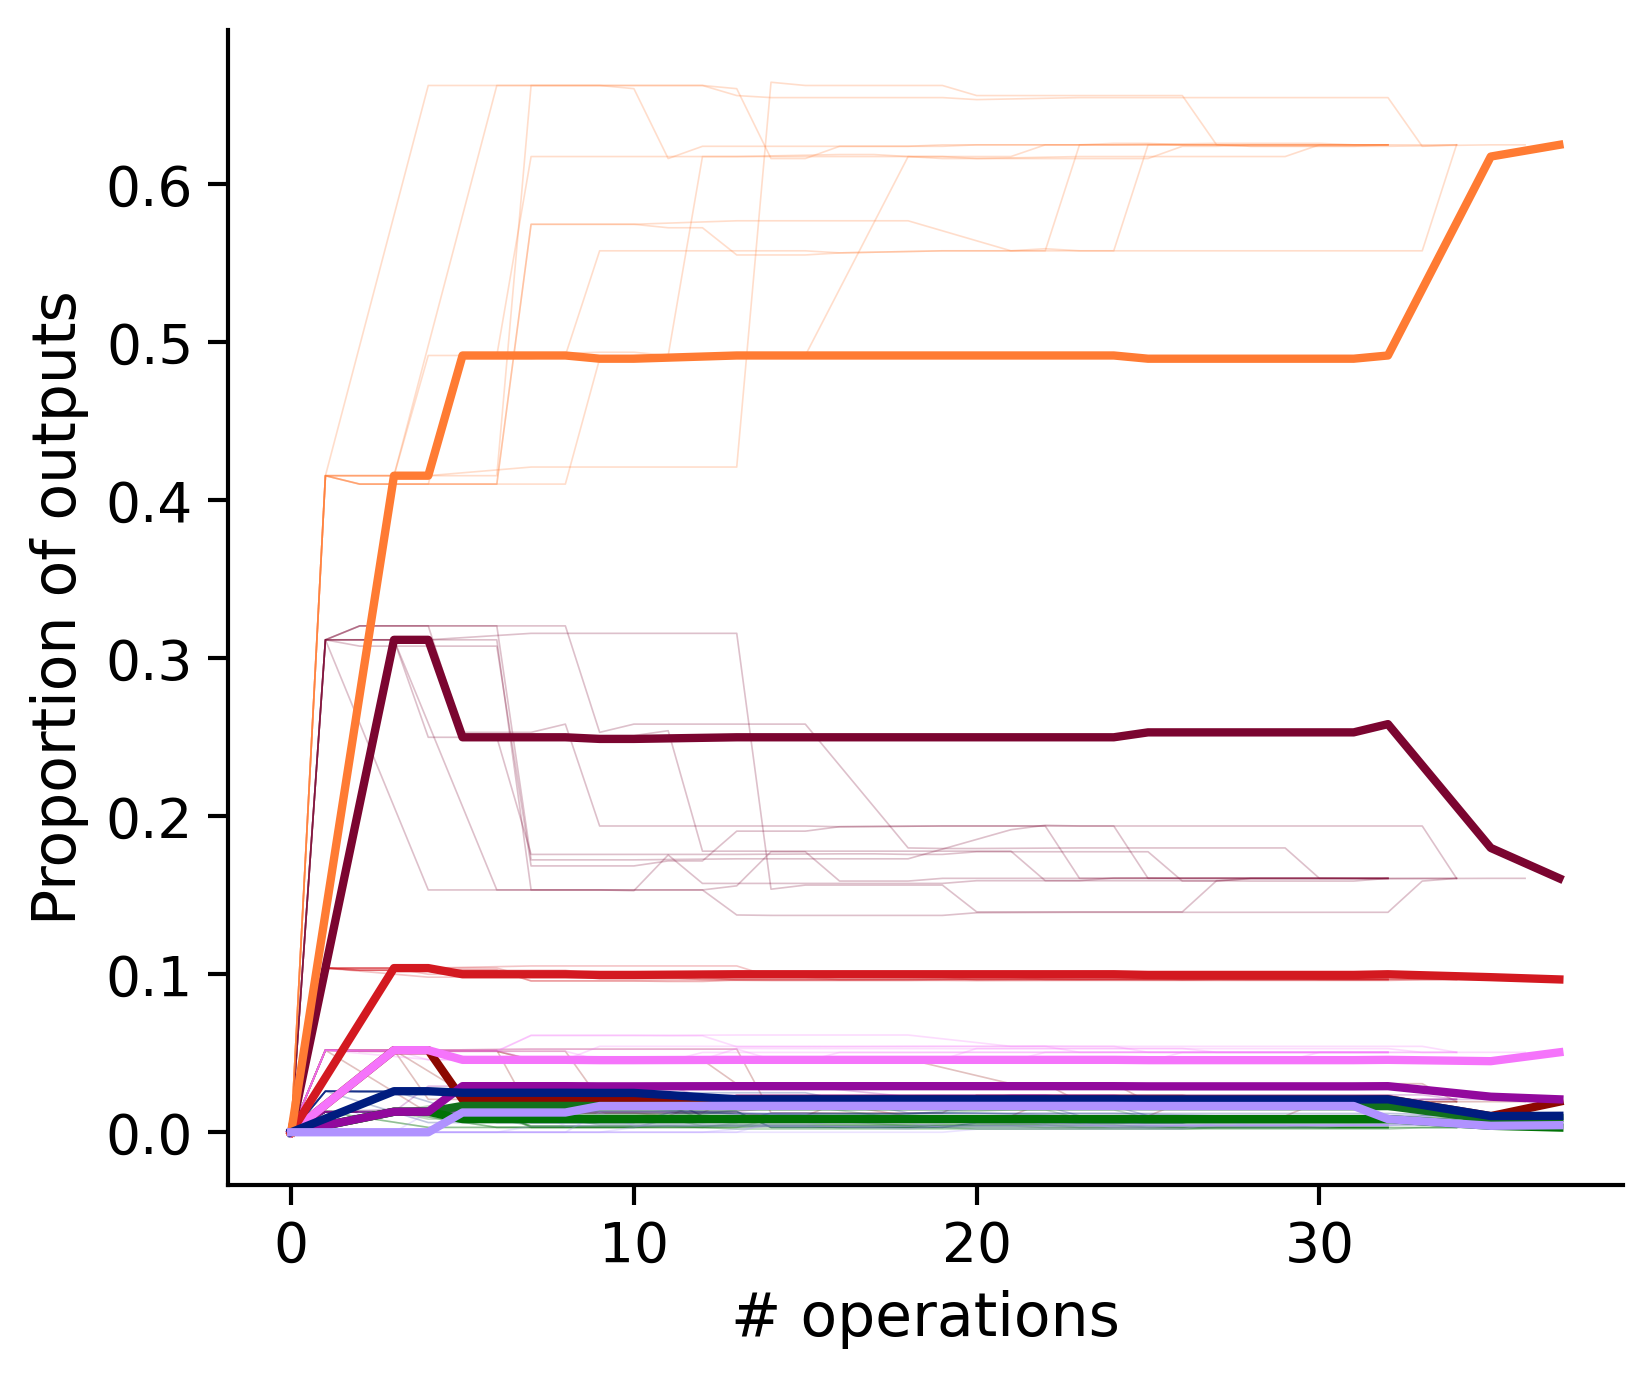
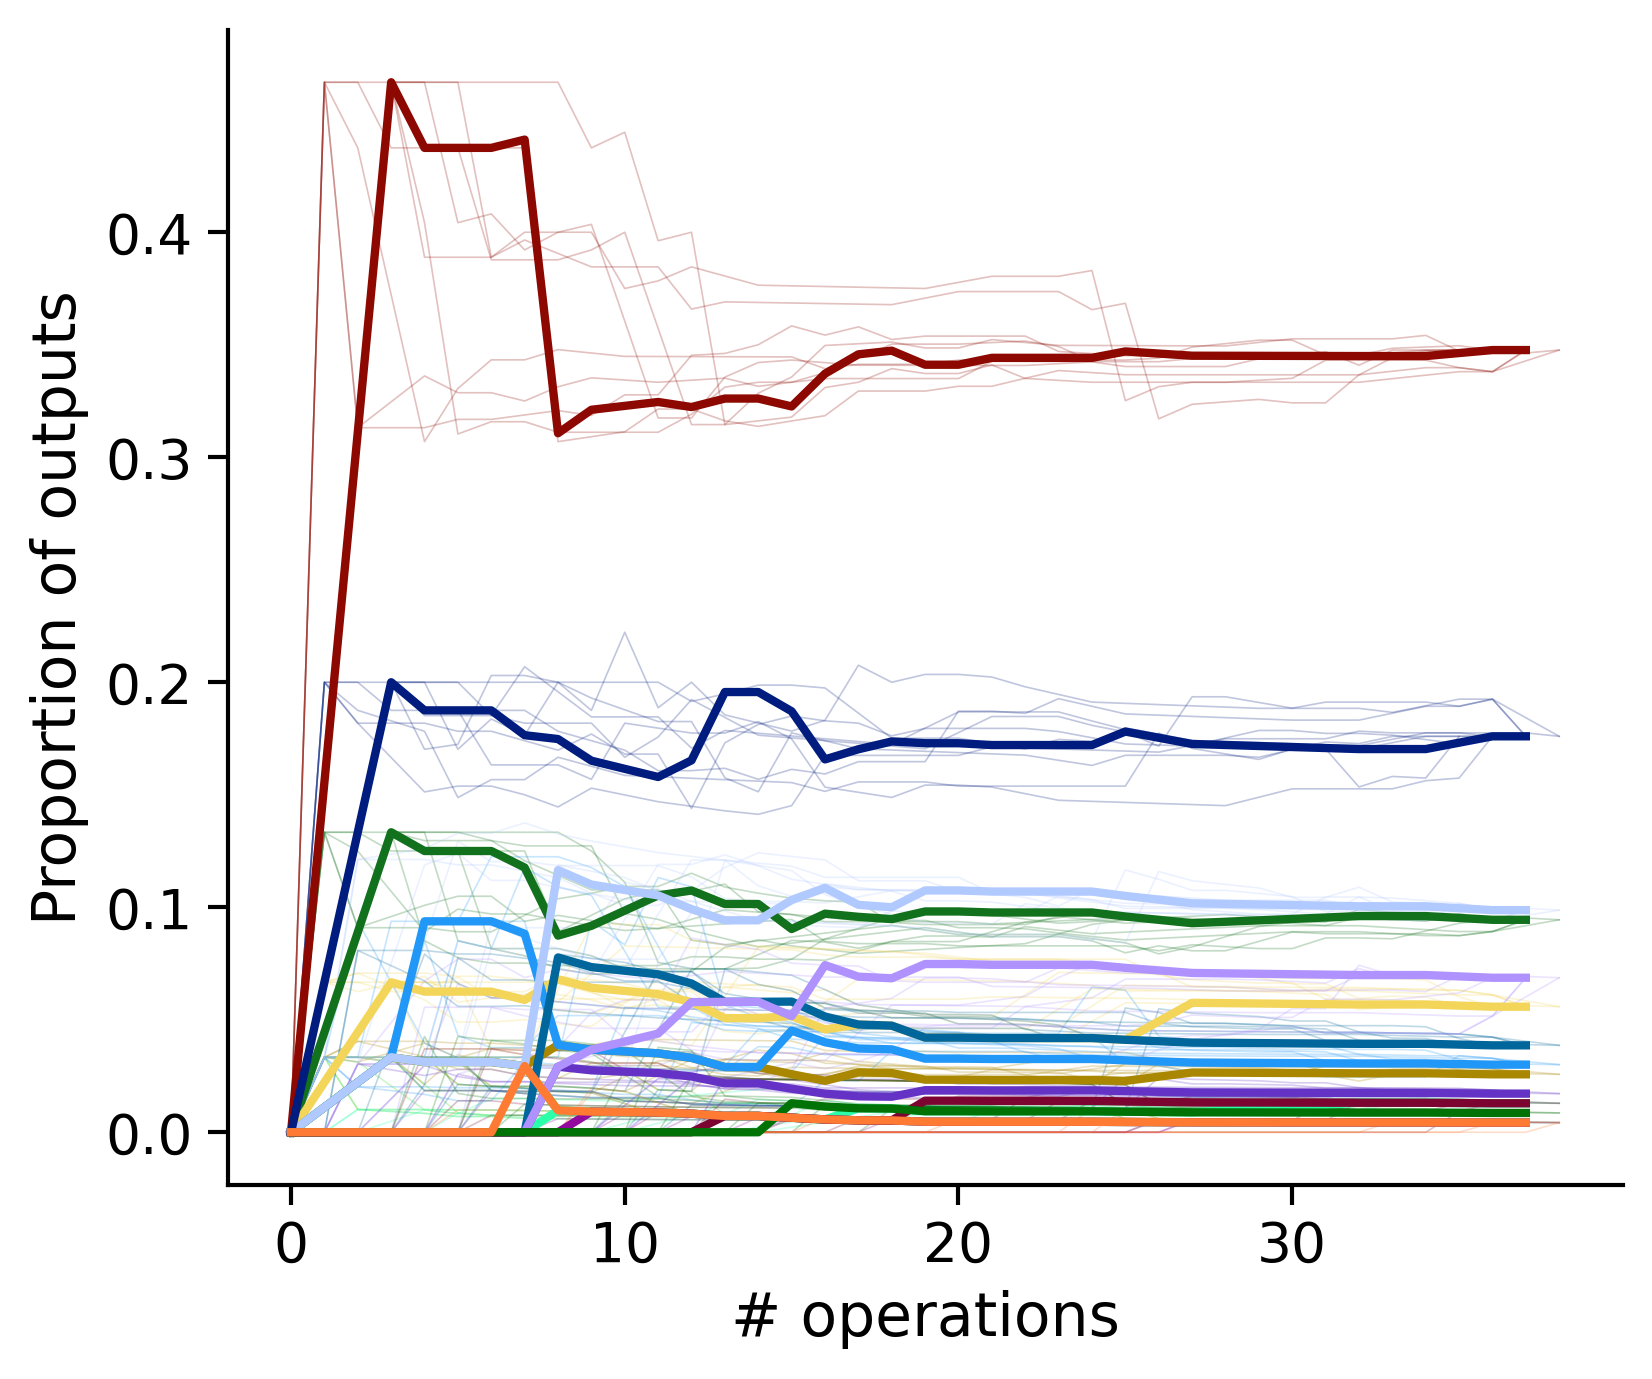
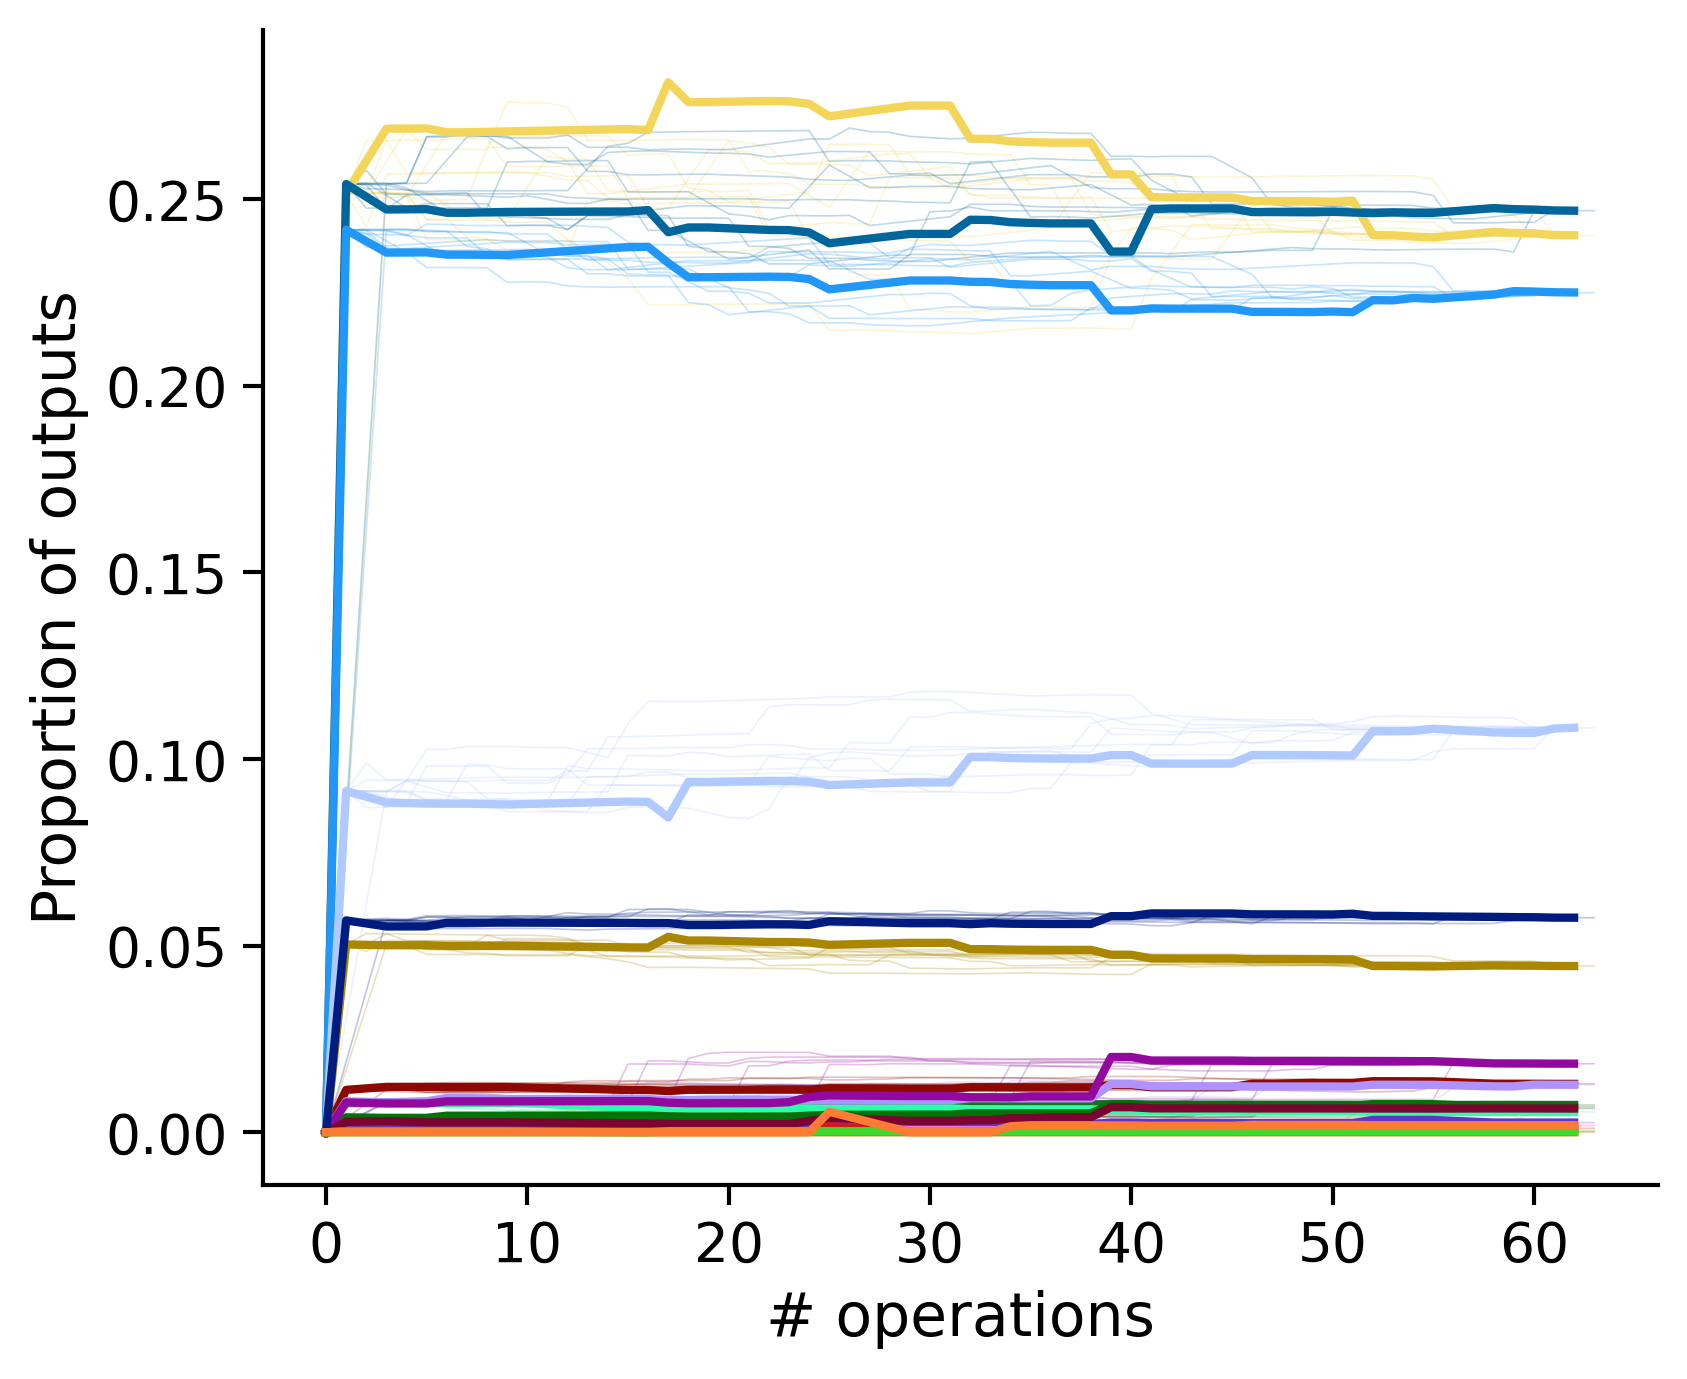
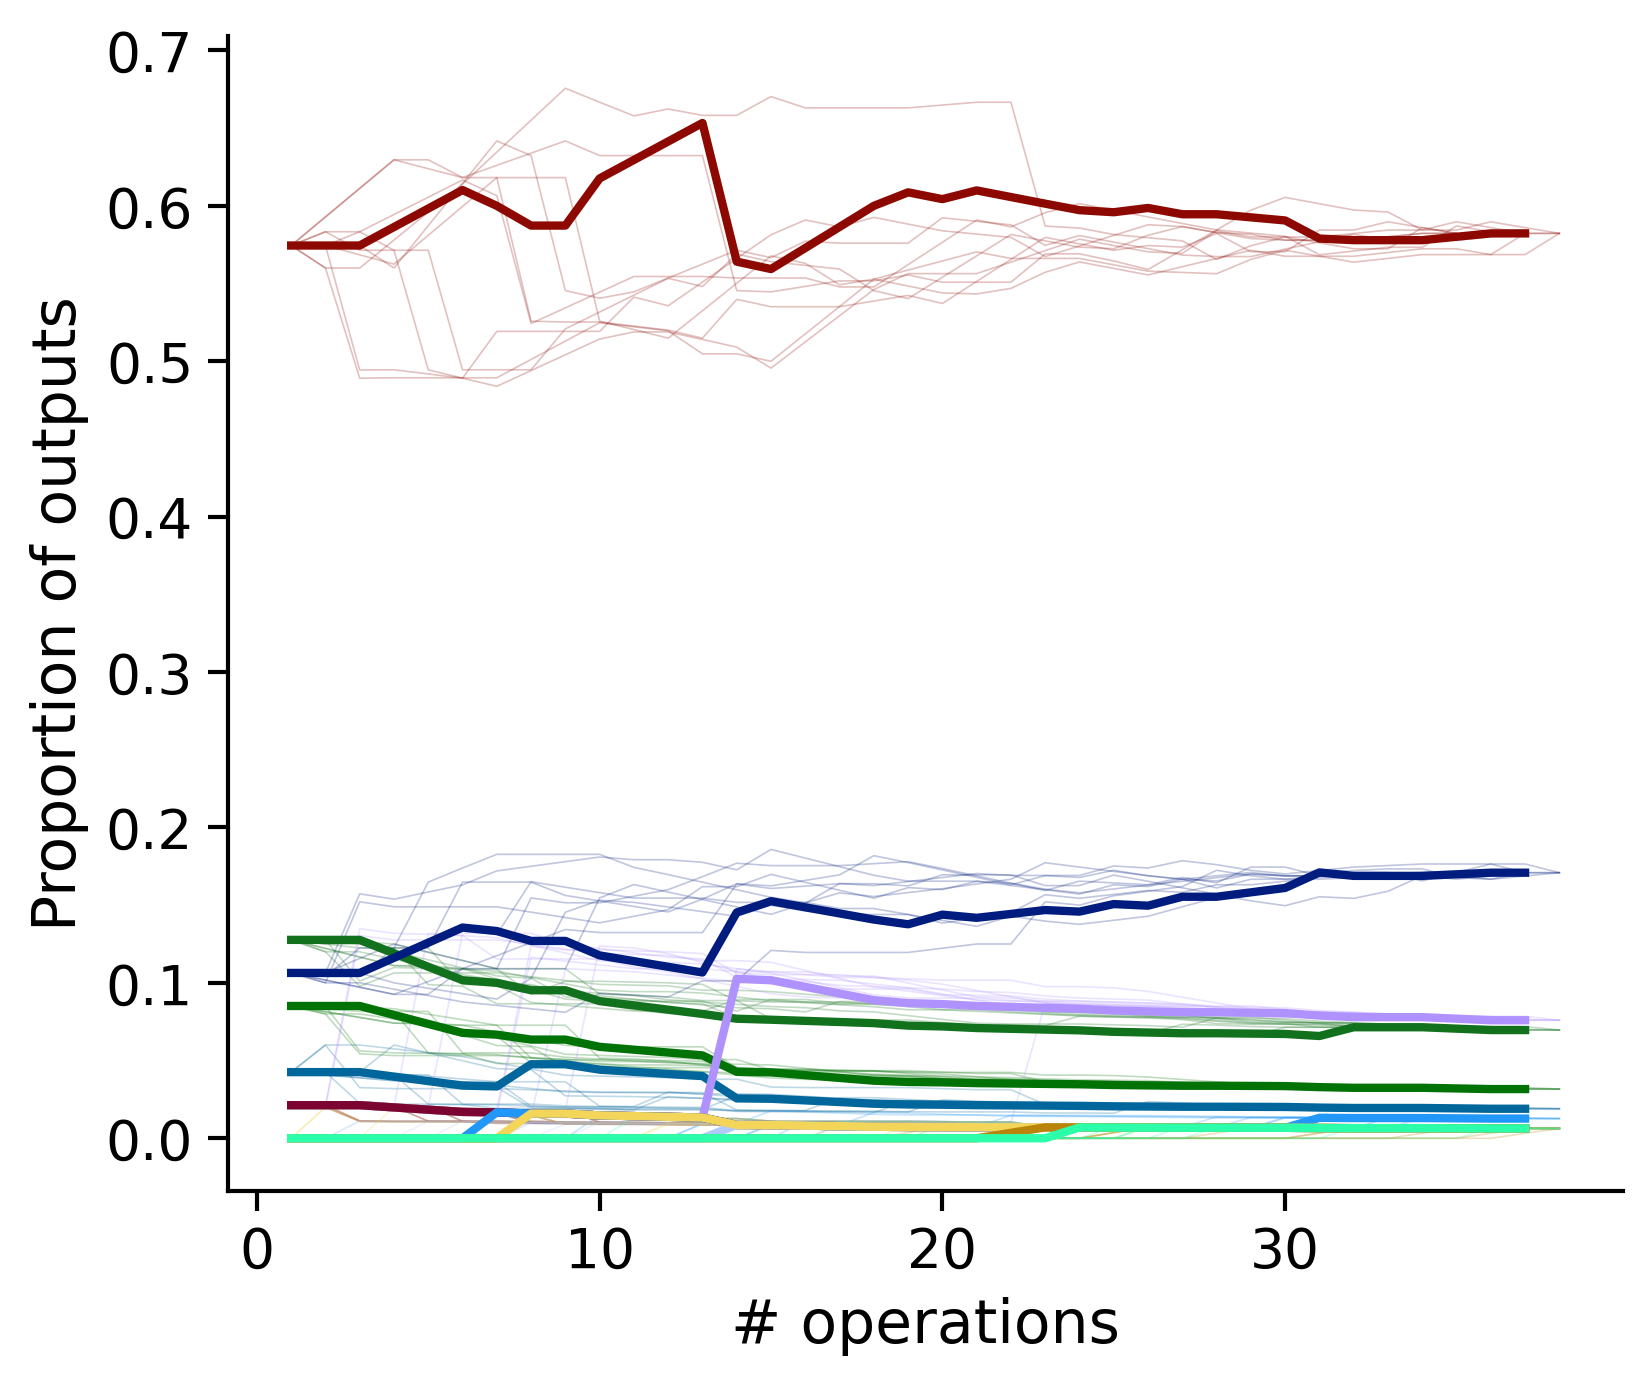
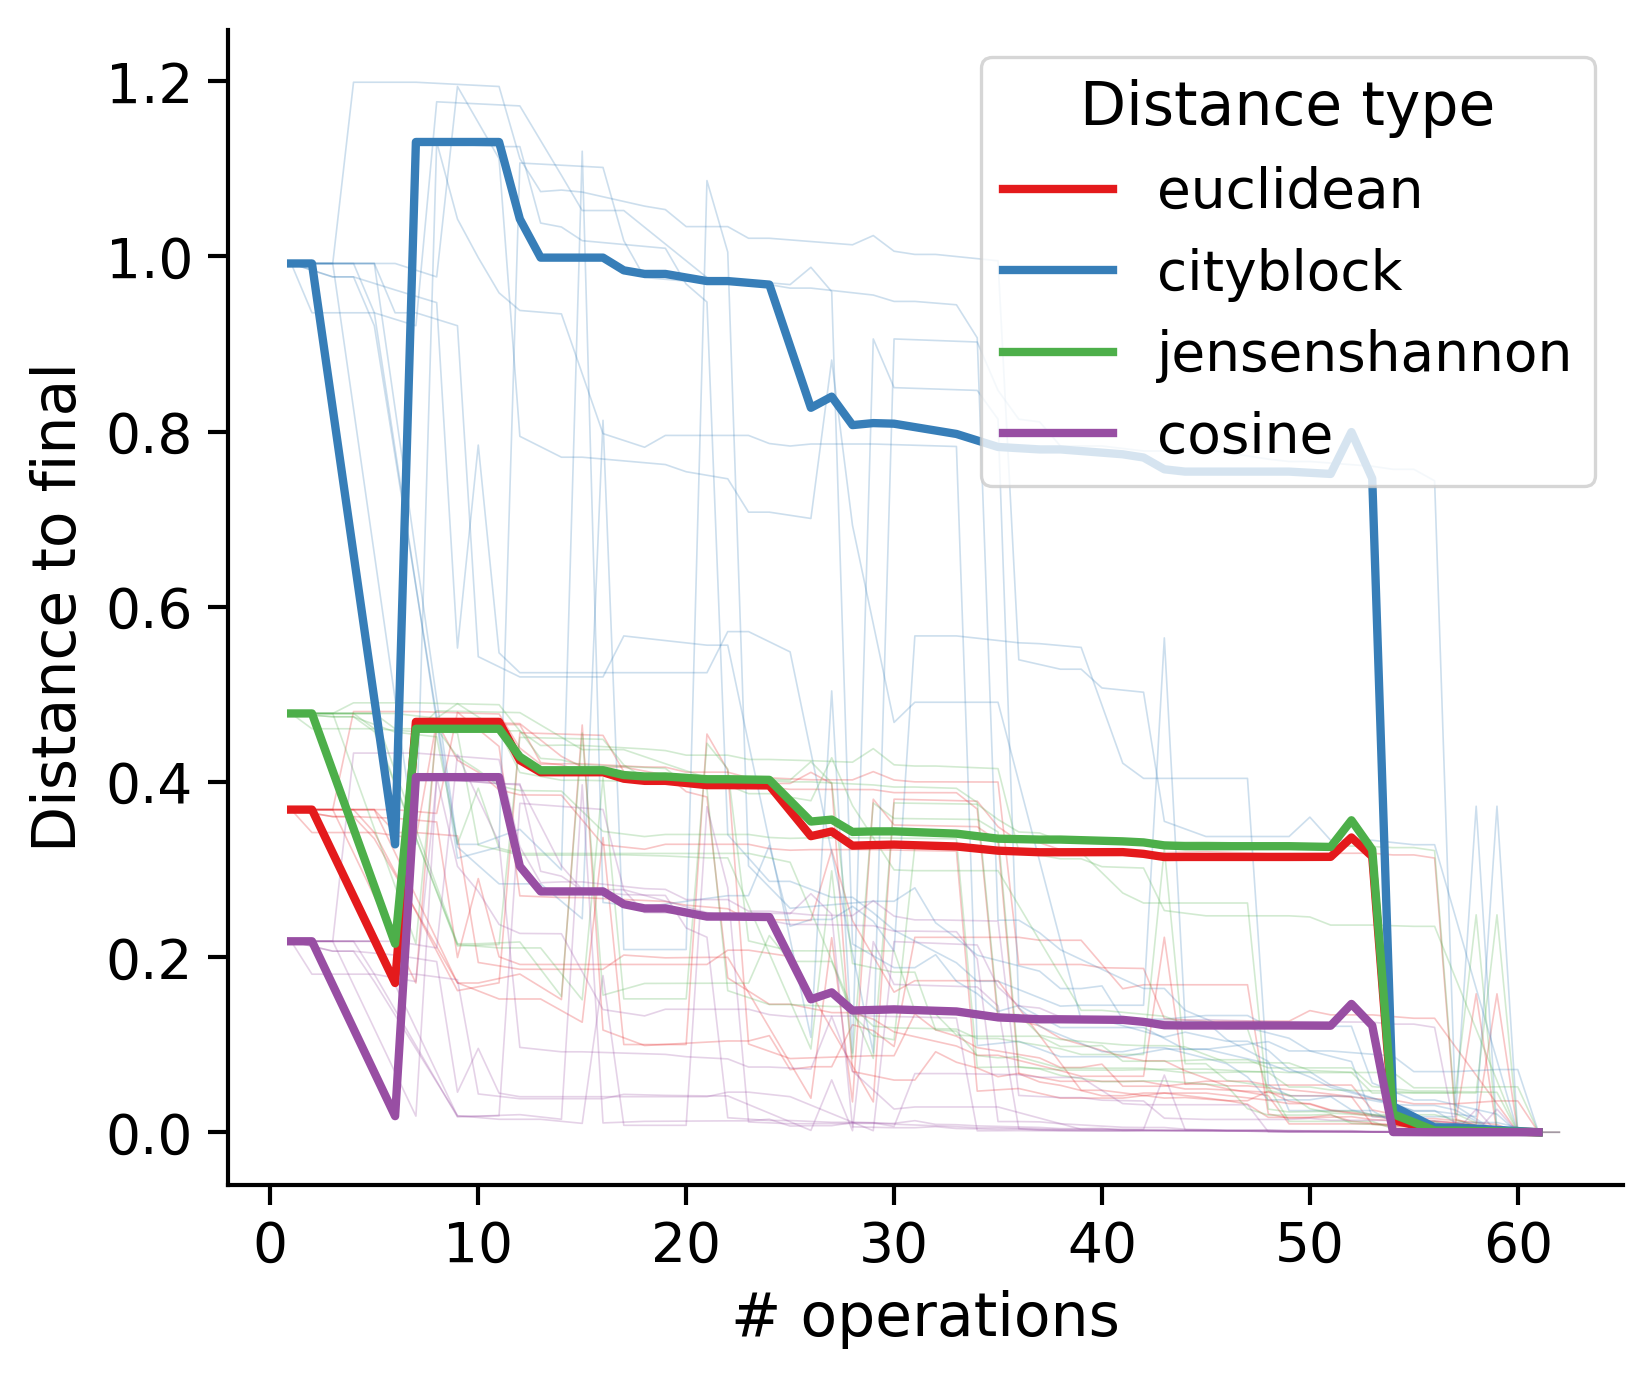

Outputs by distance metric
TODO: same treatment as the above
Summary
Neuron gallery
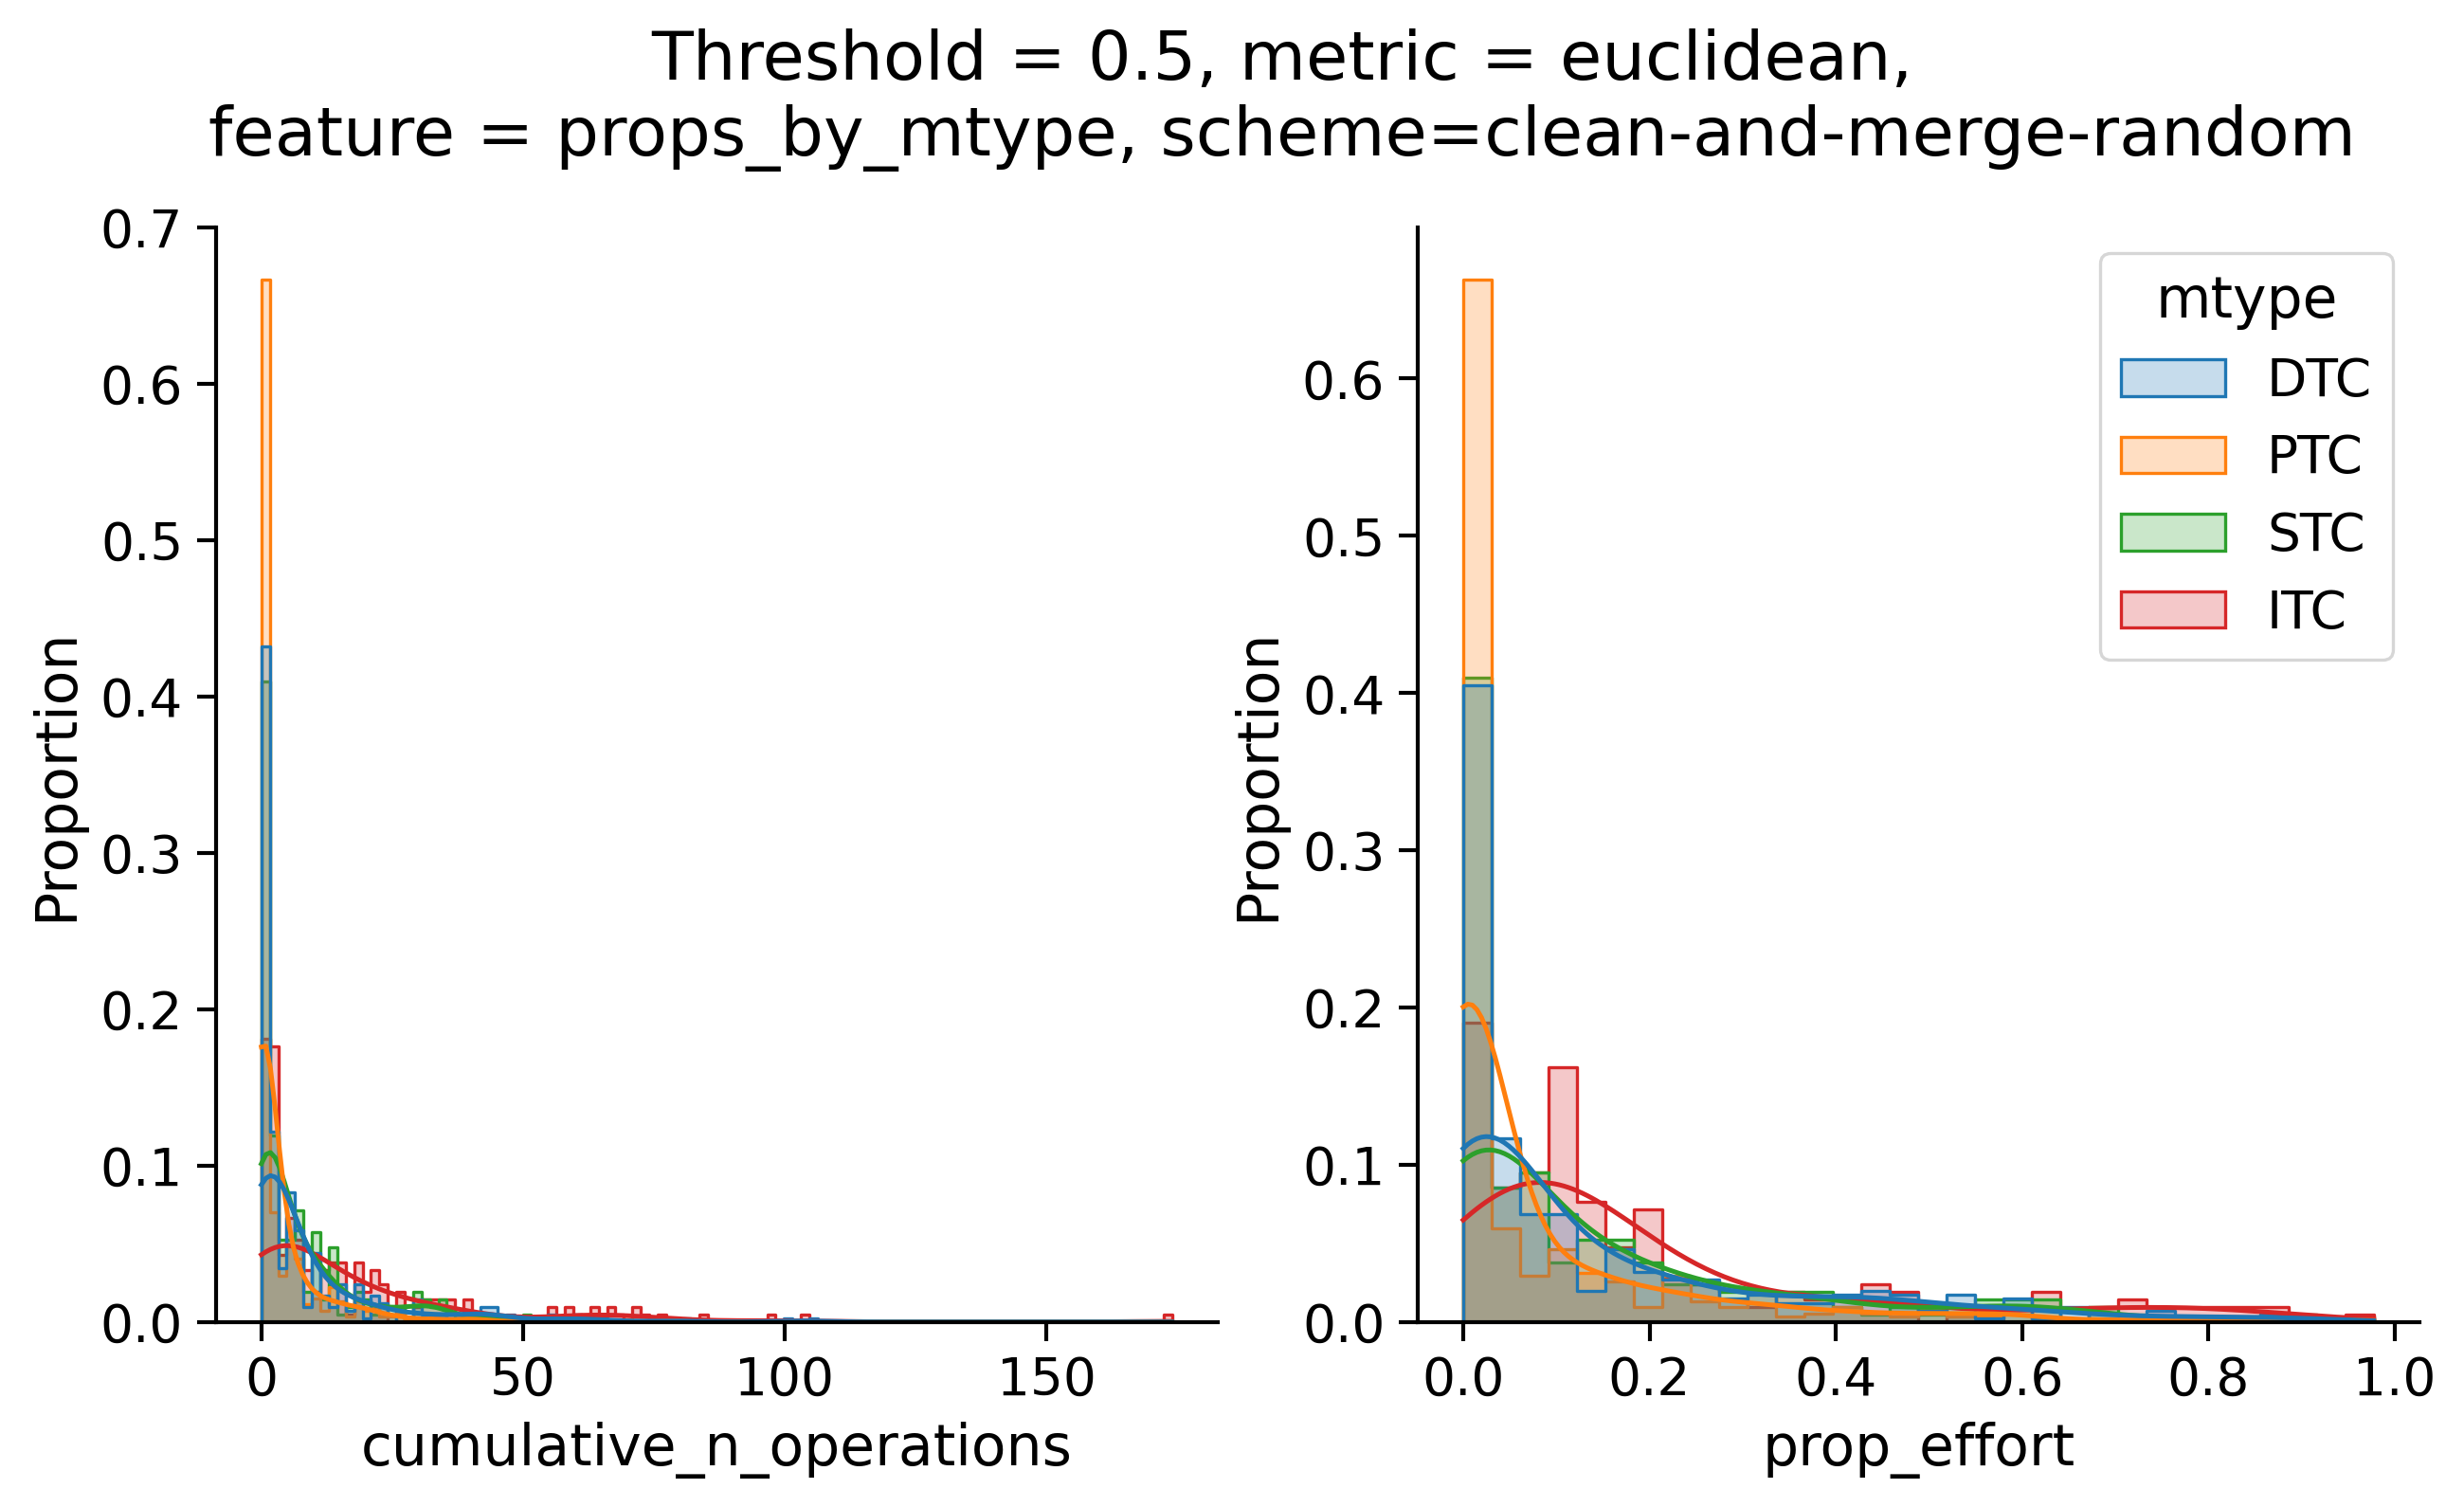
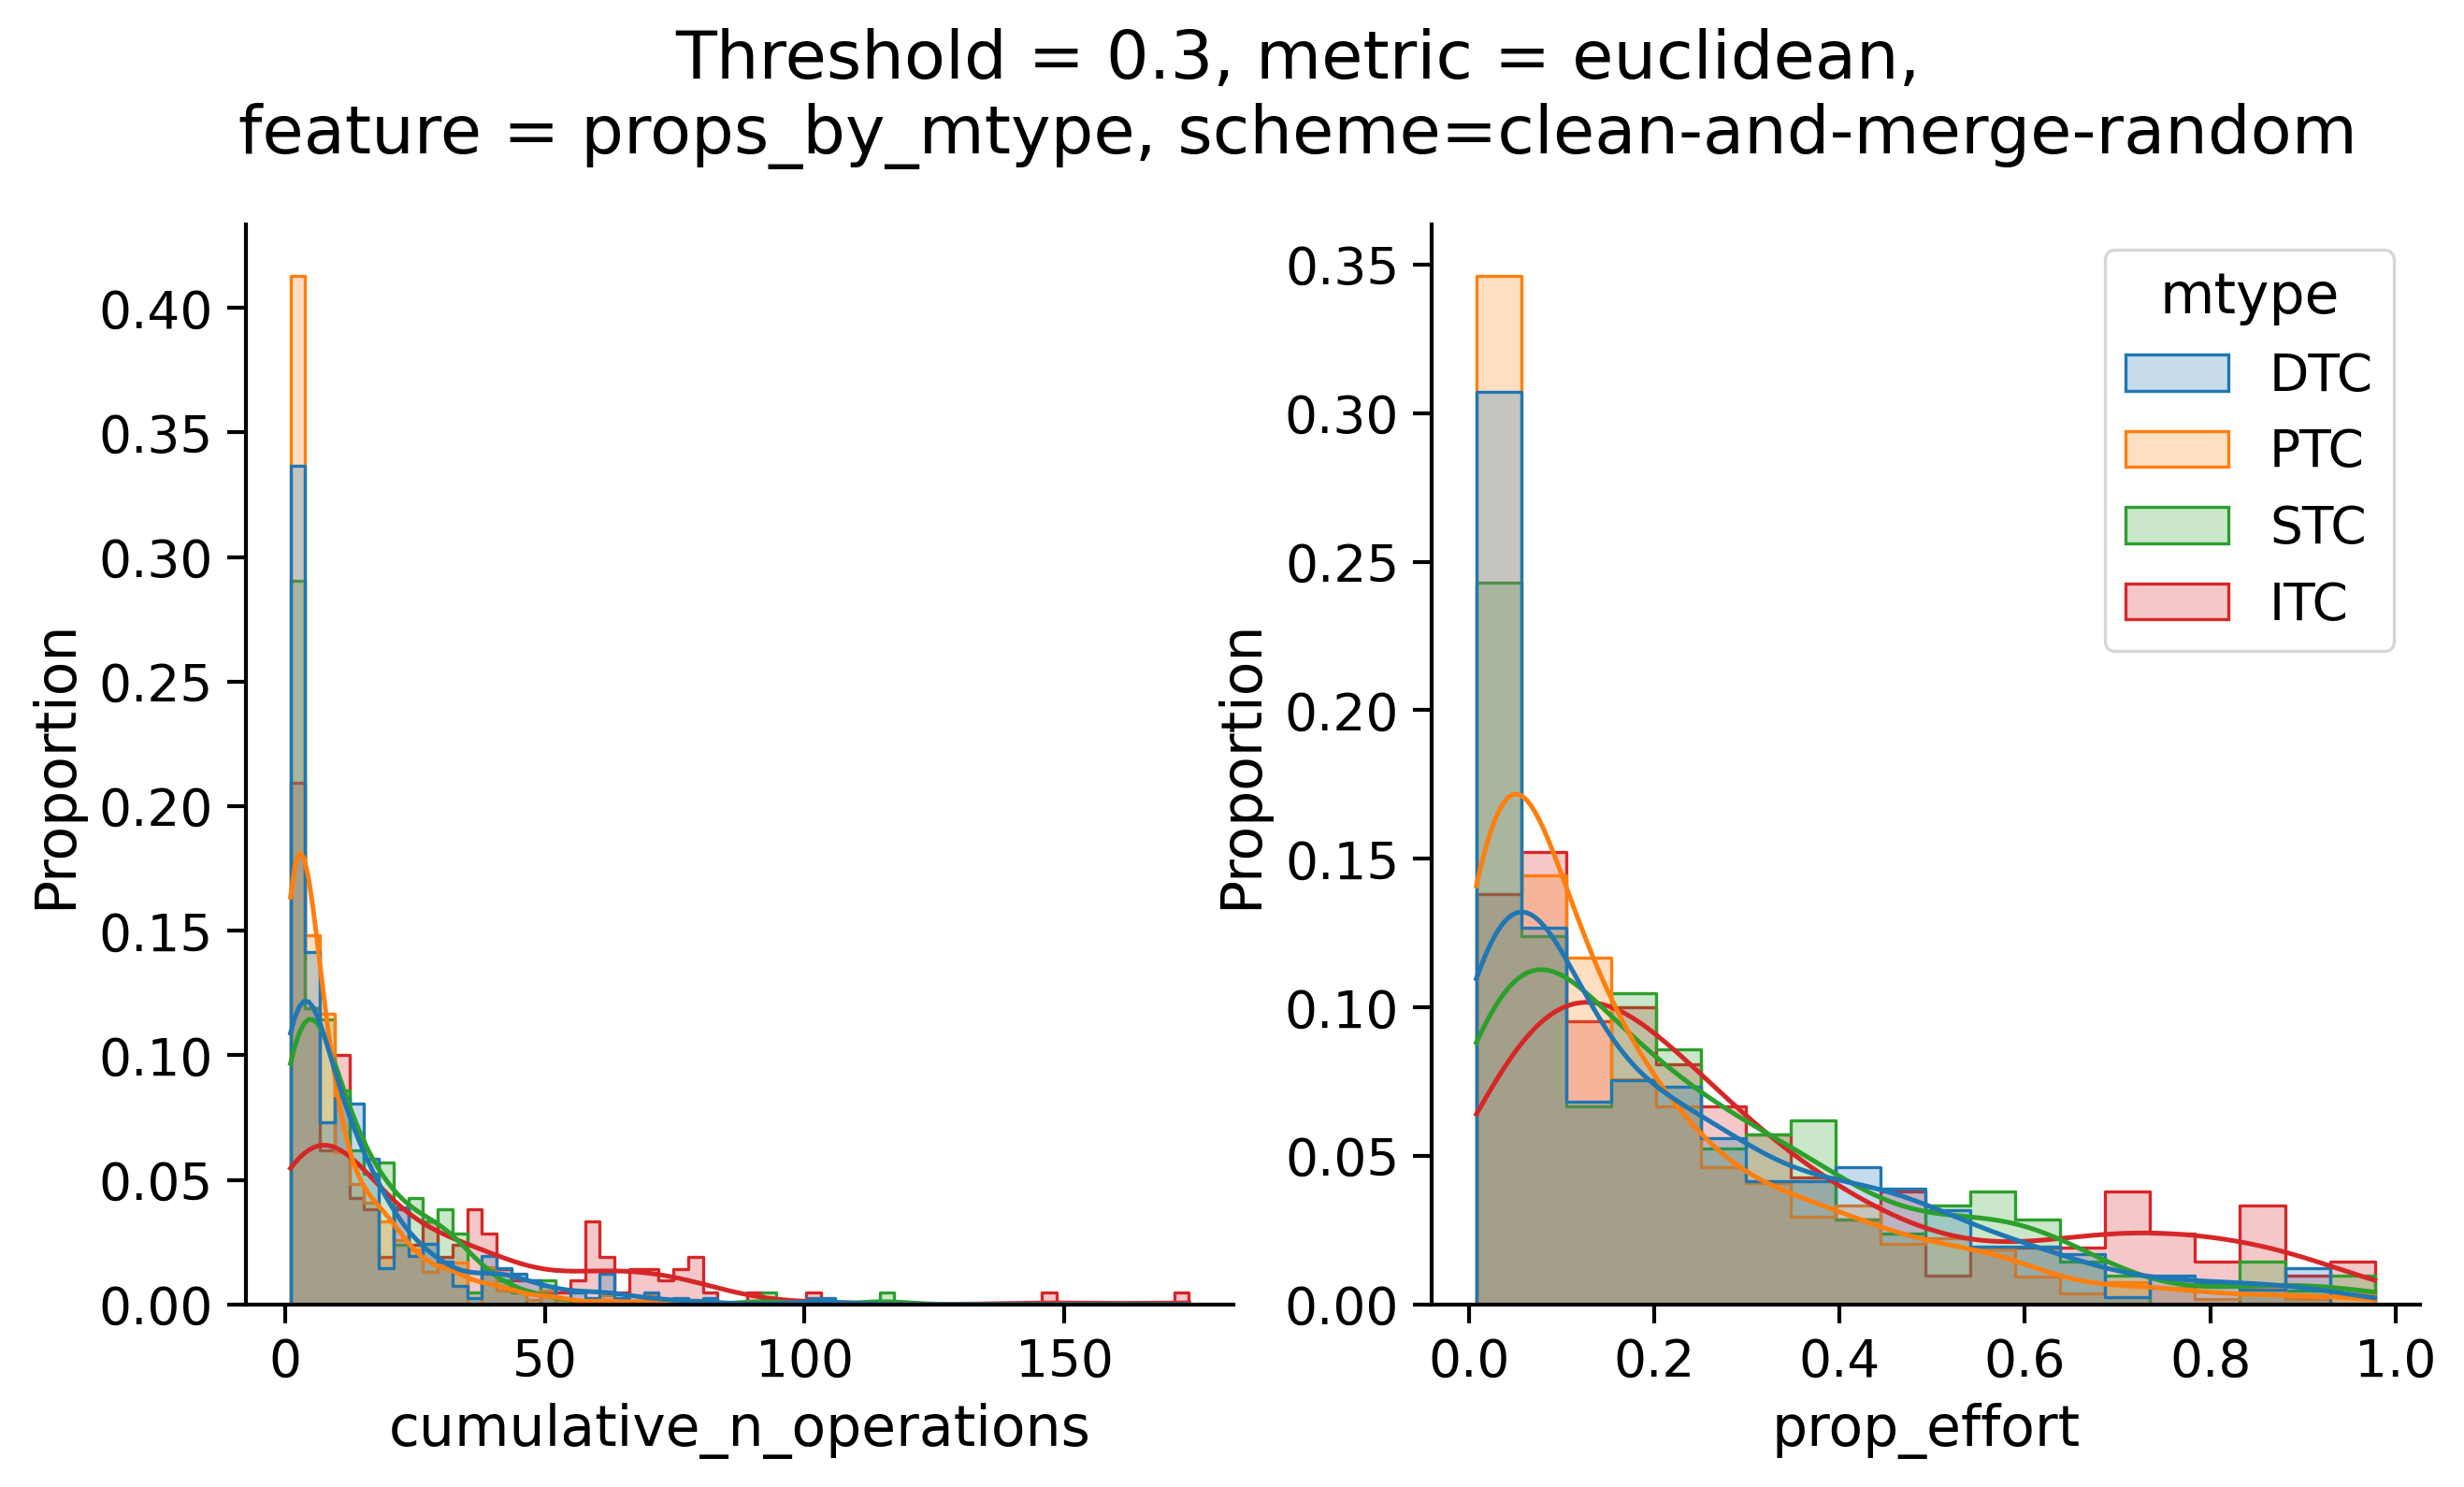
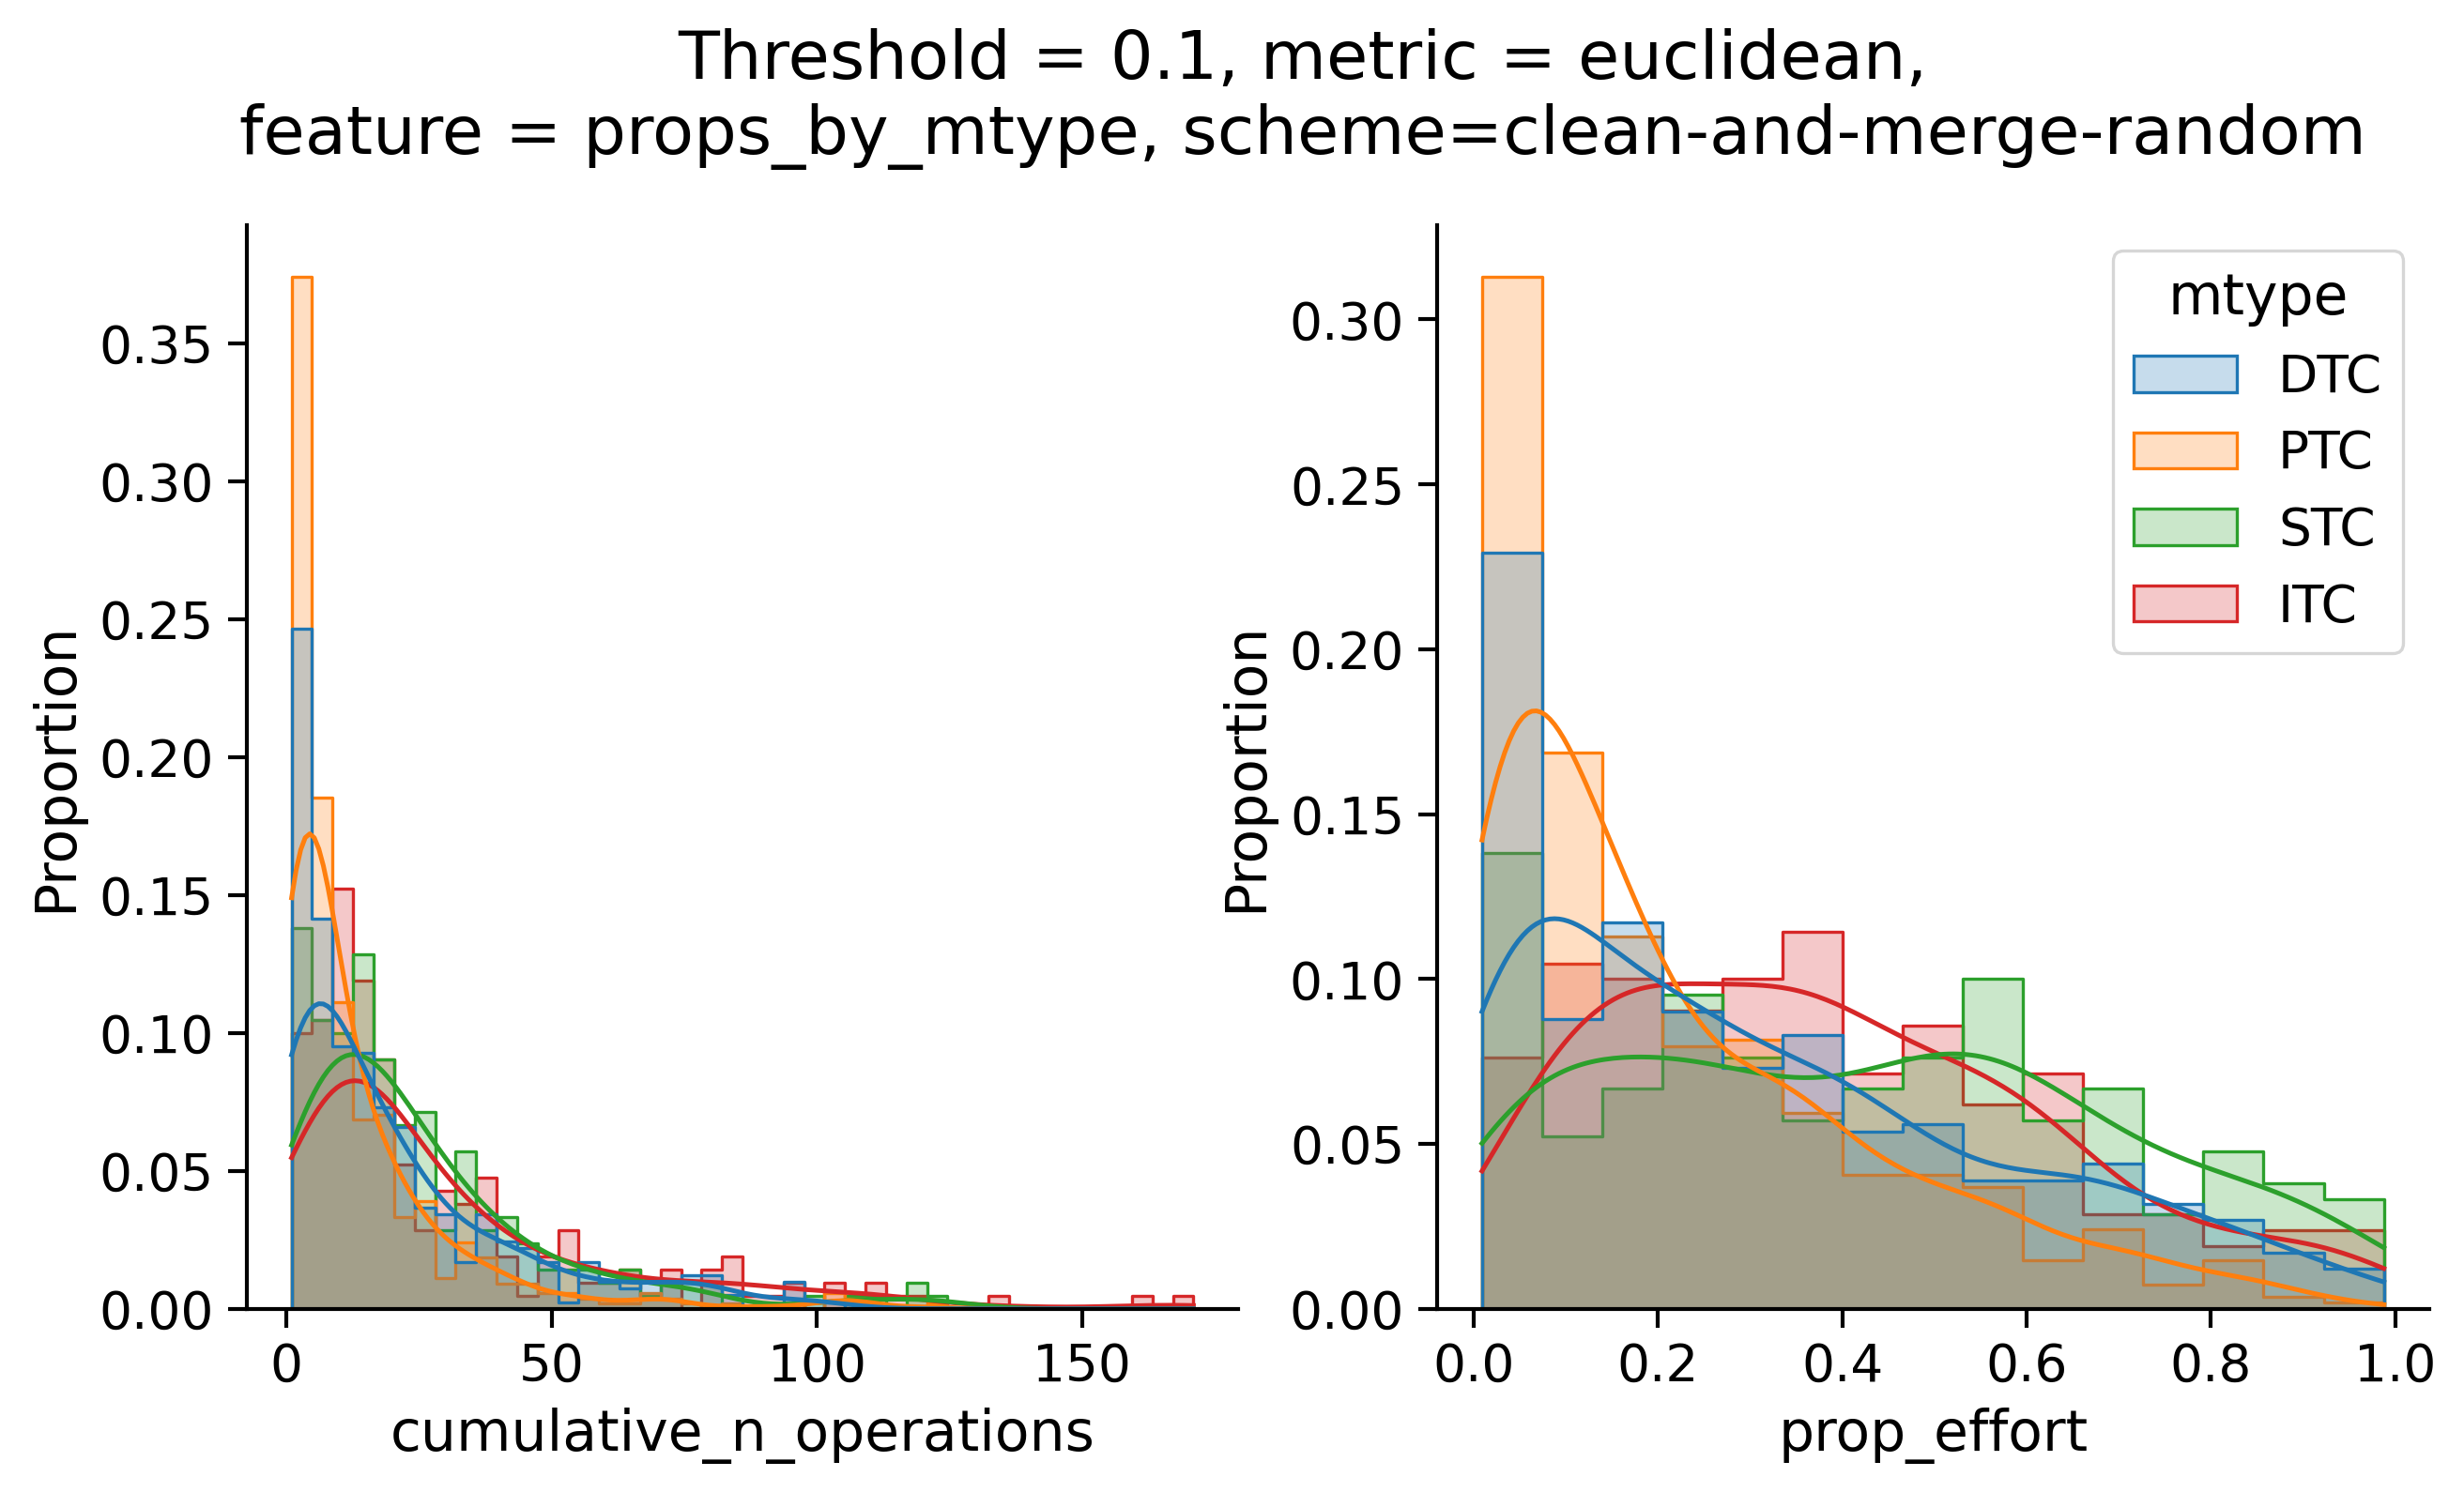
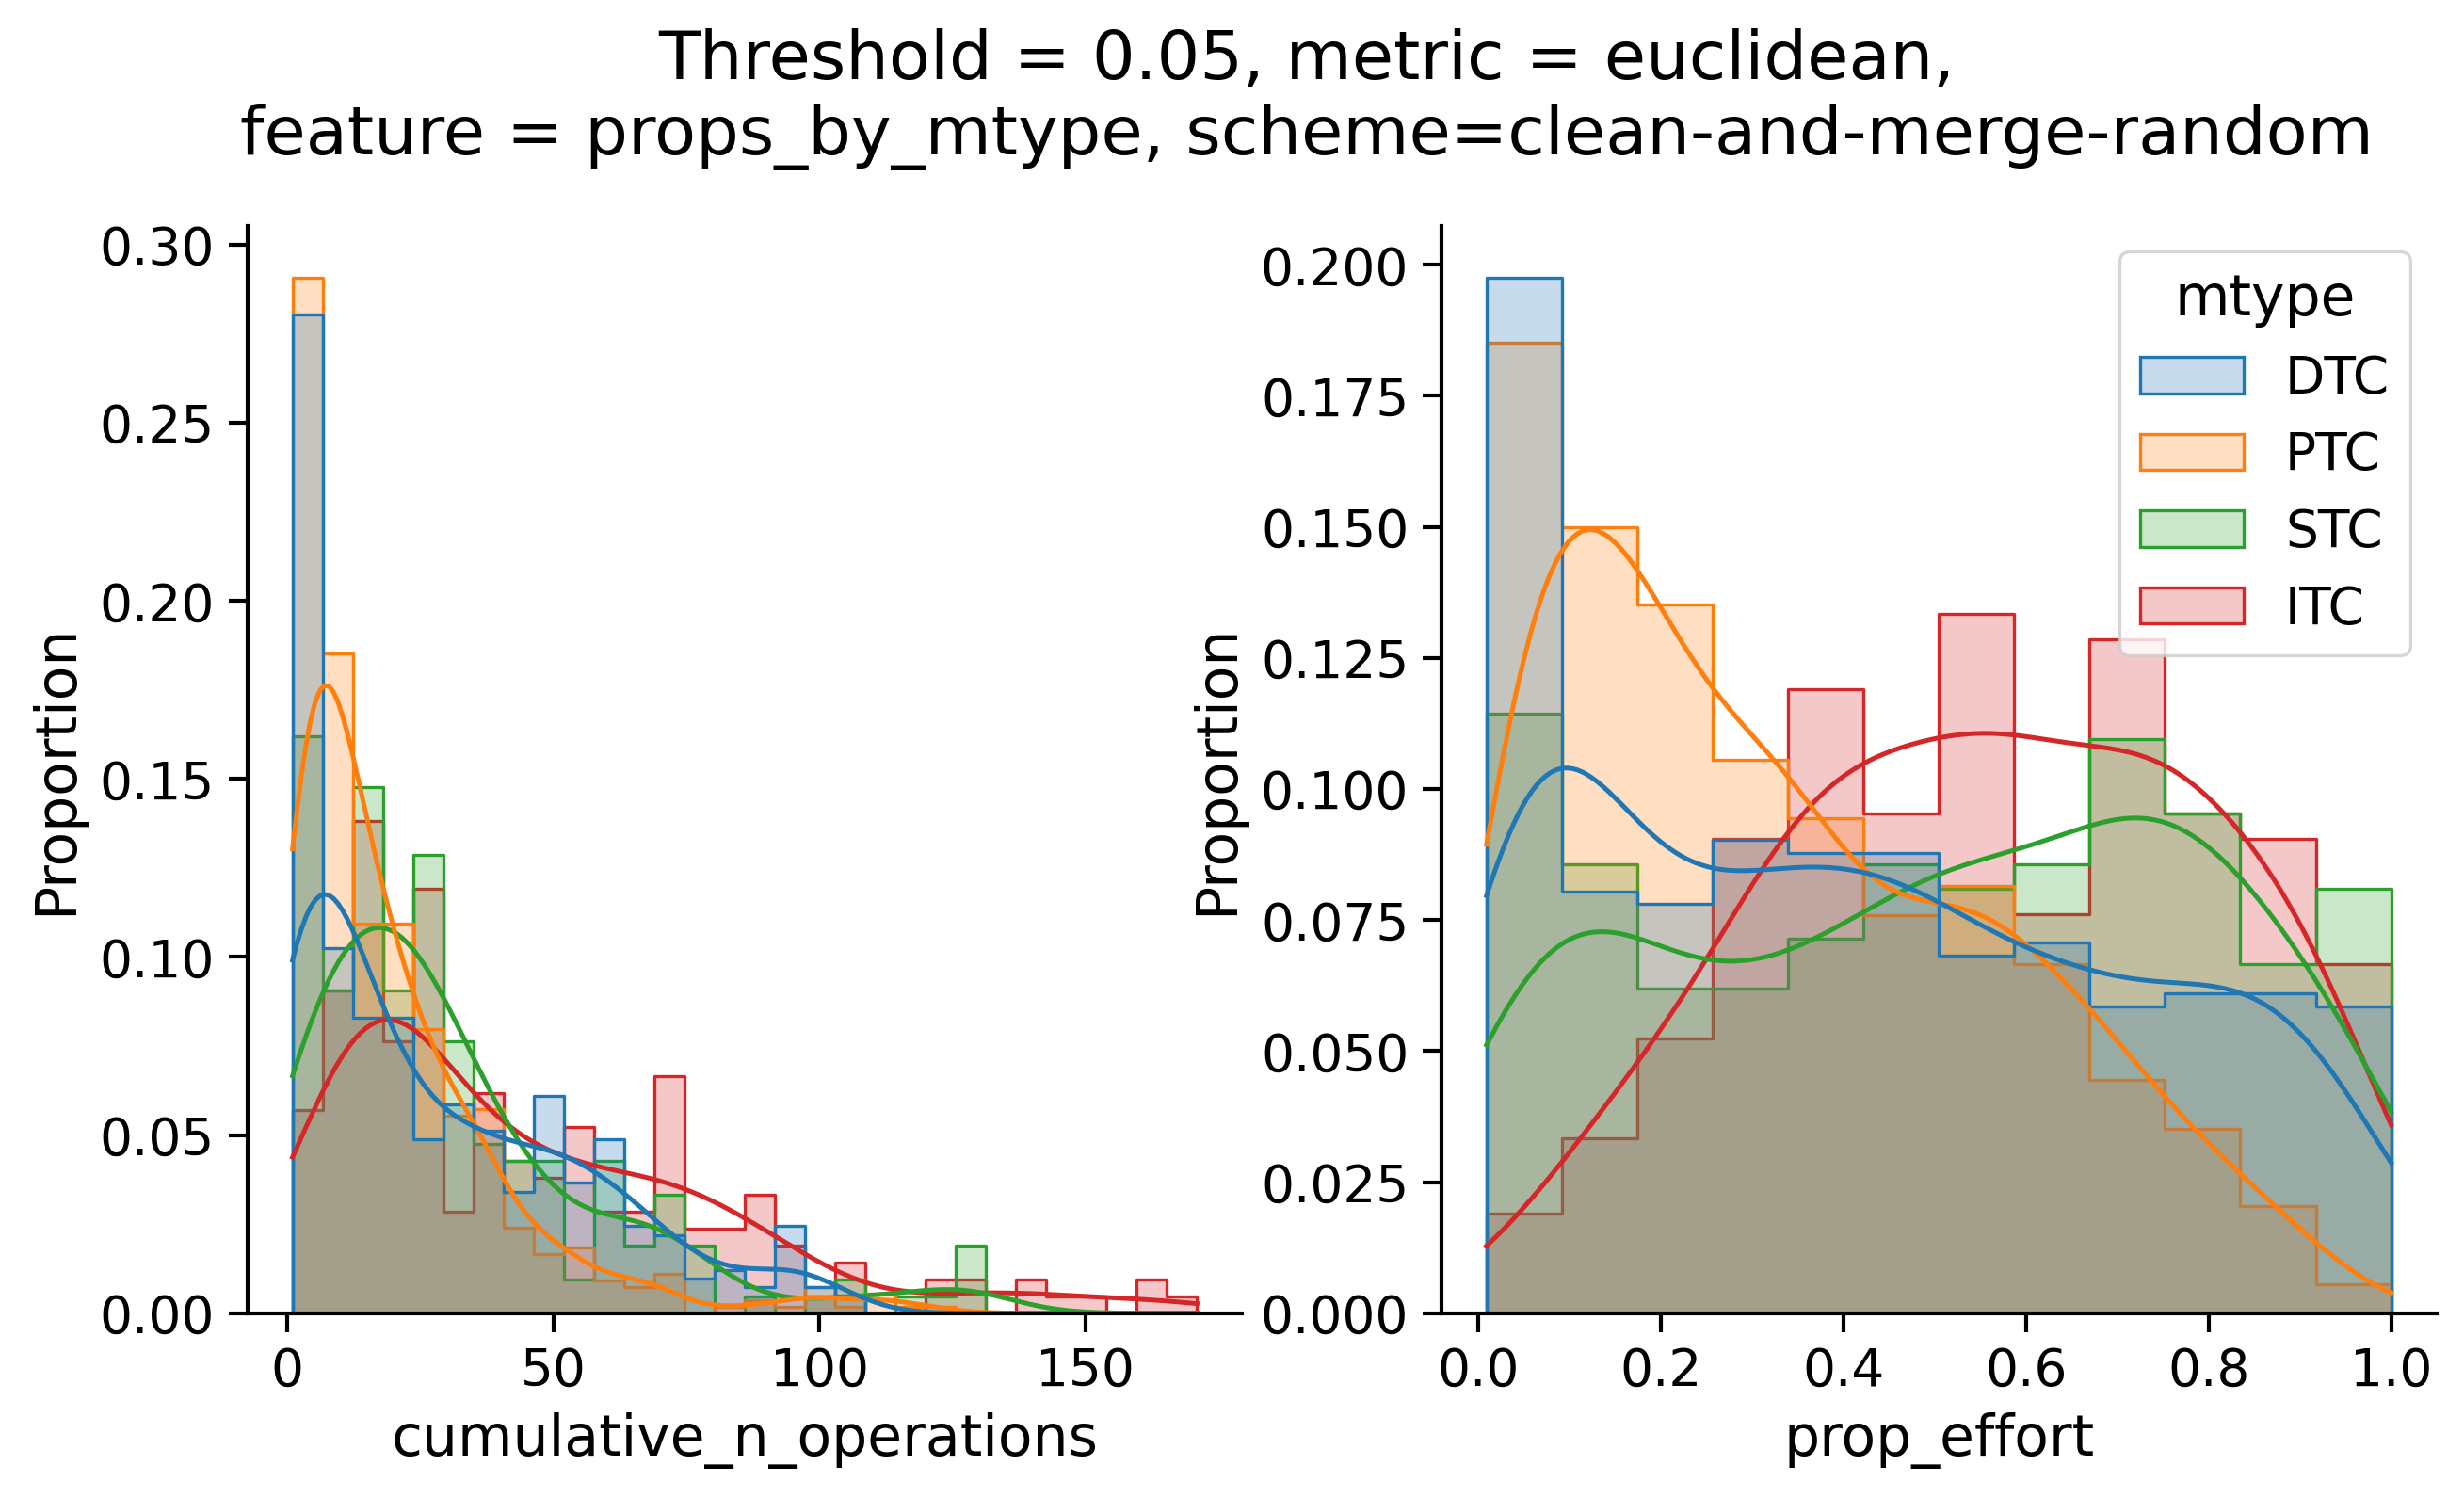
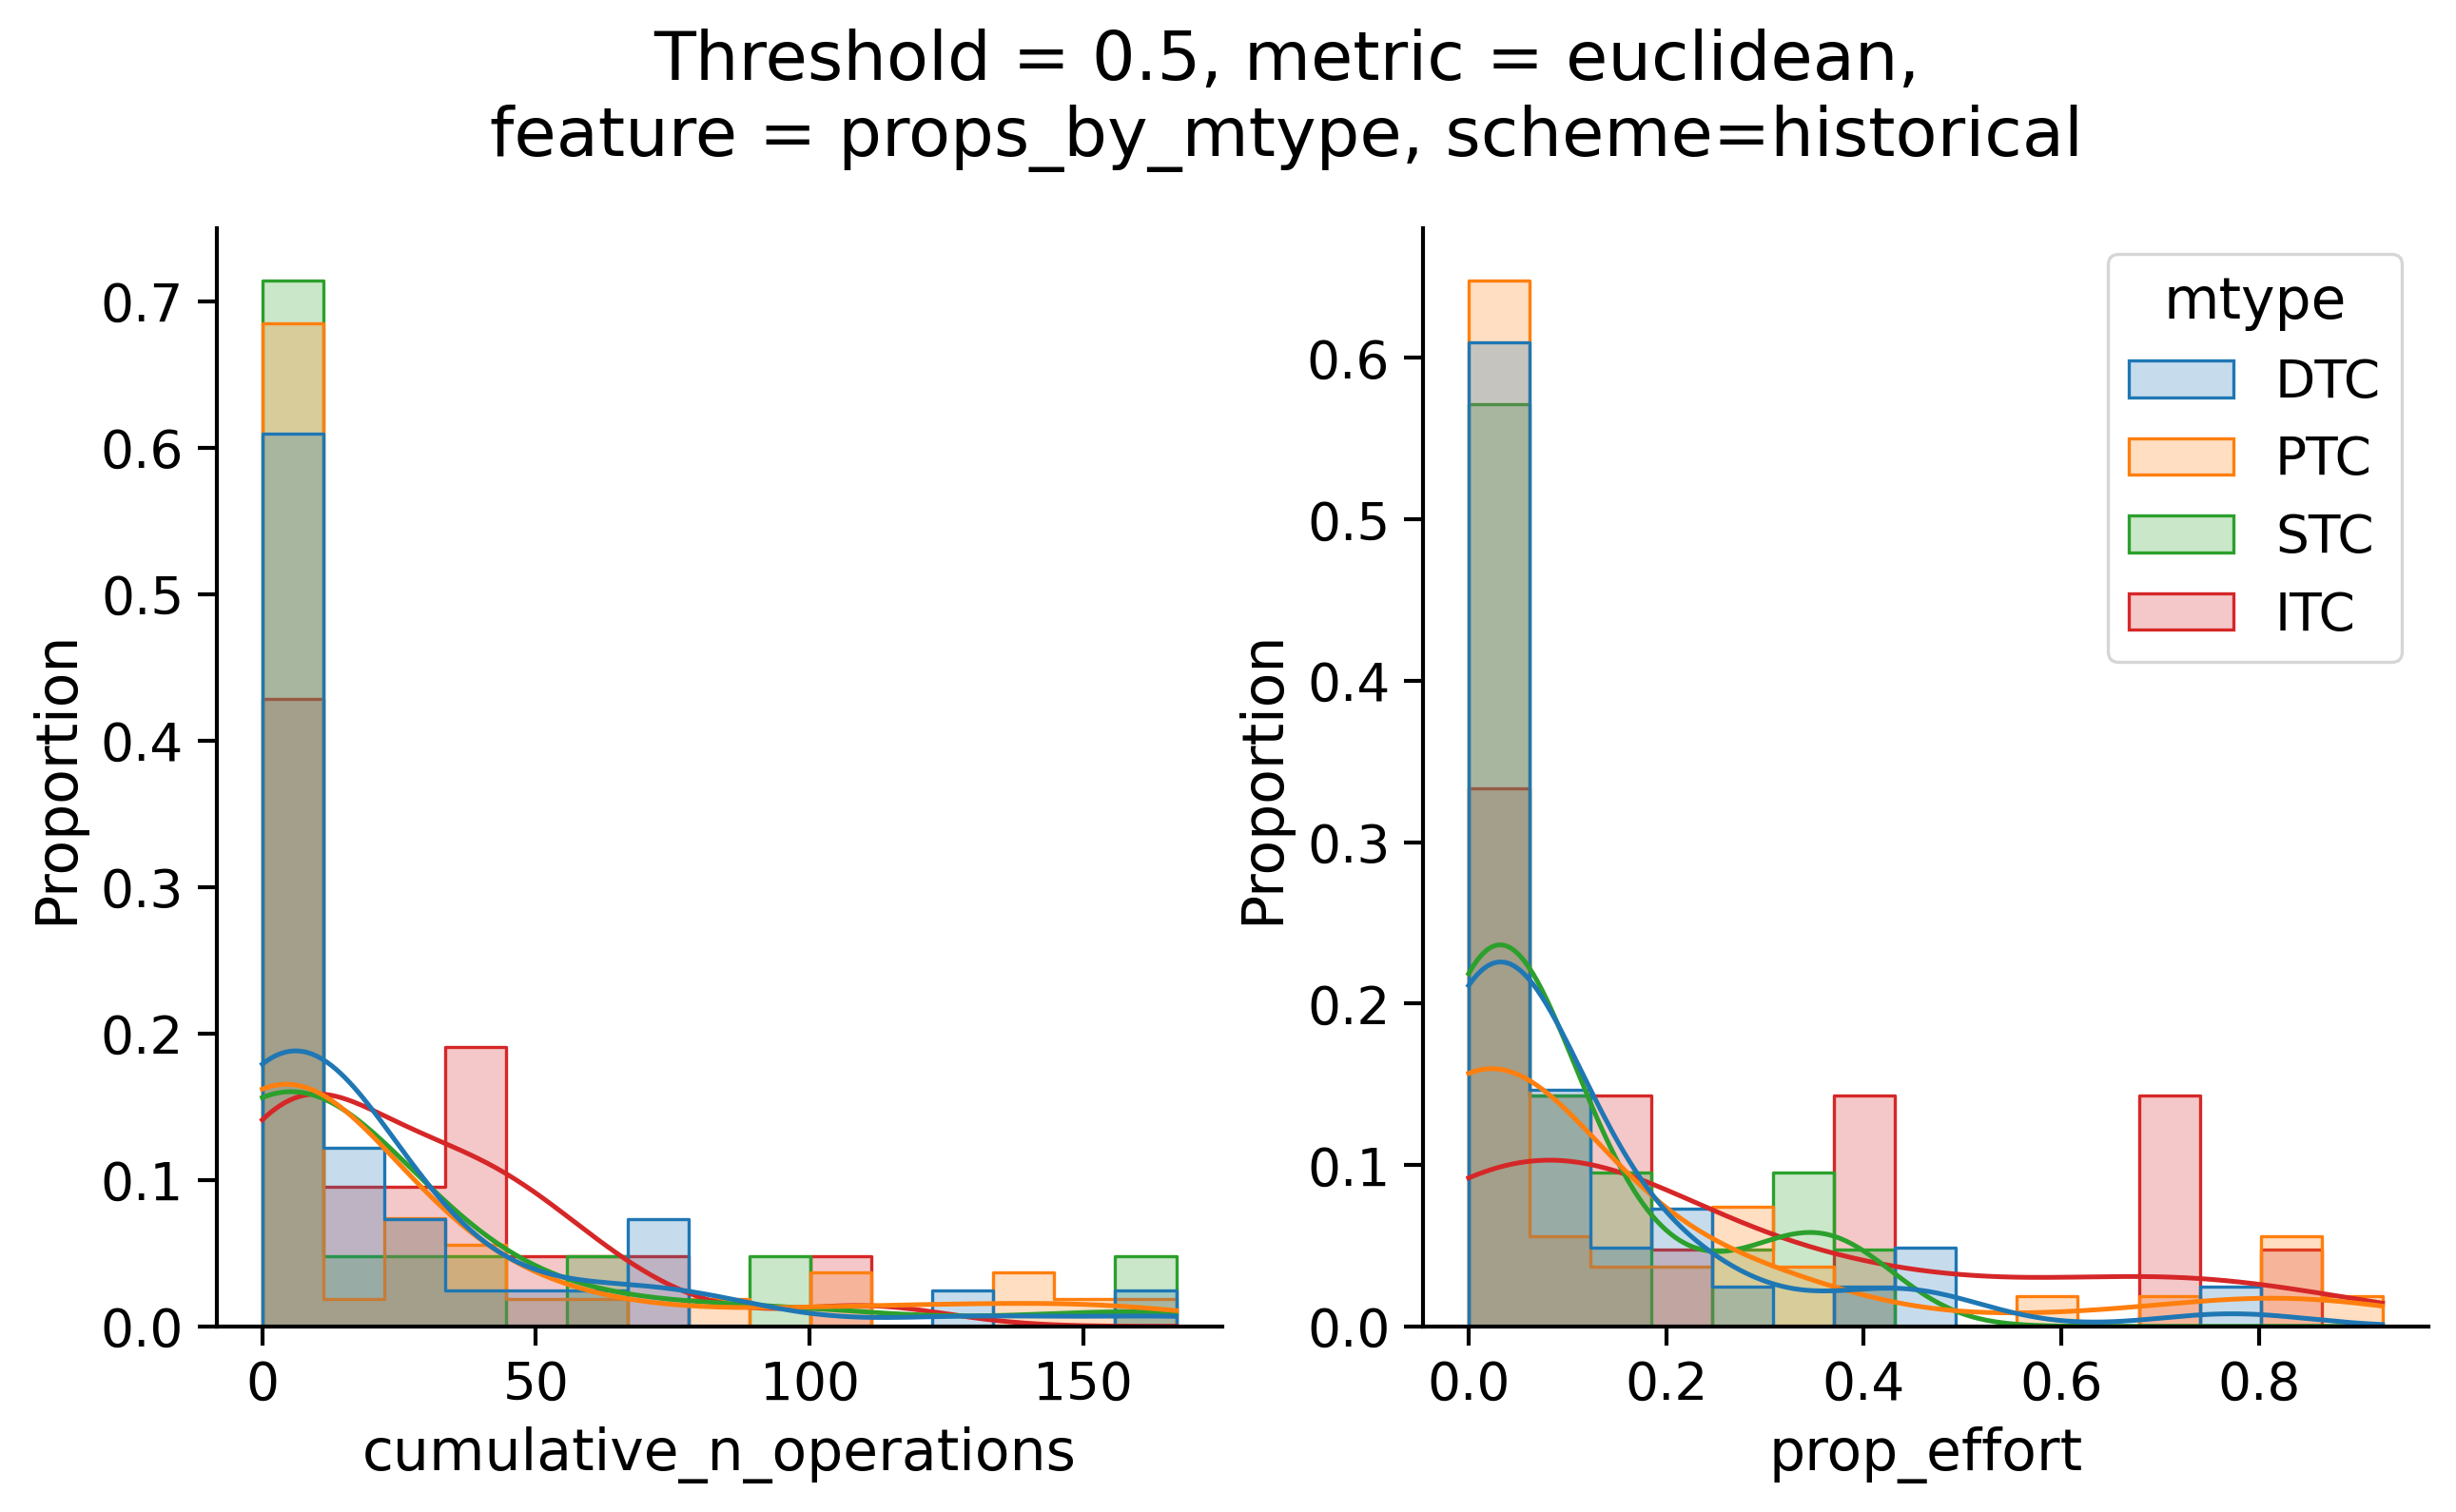
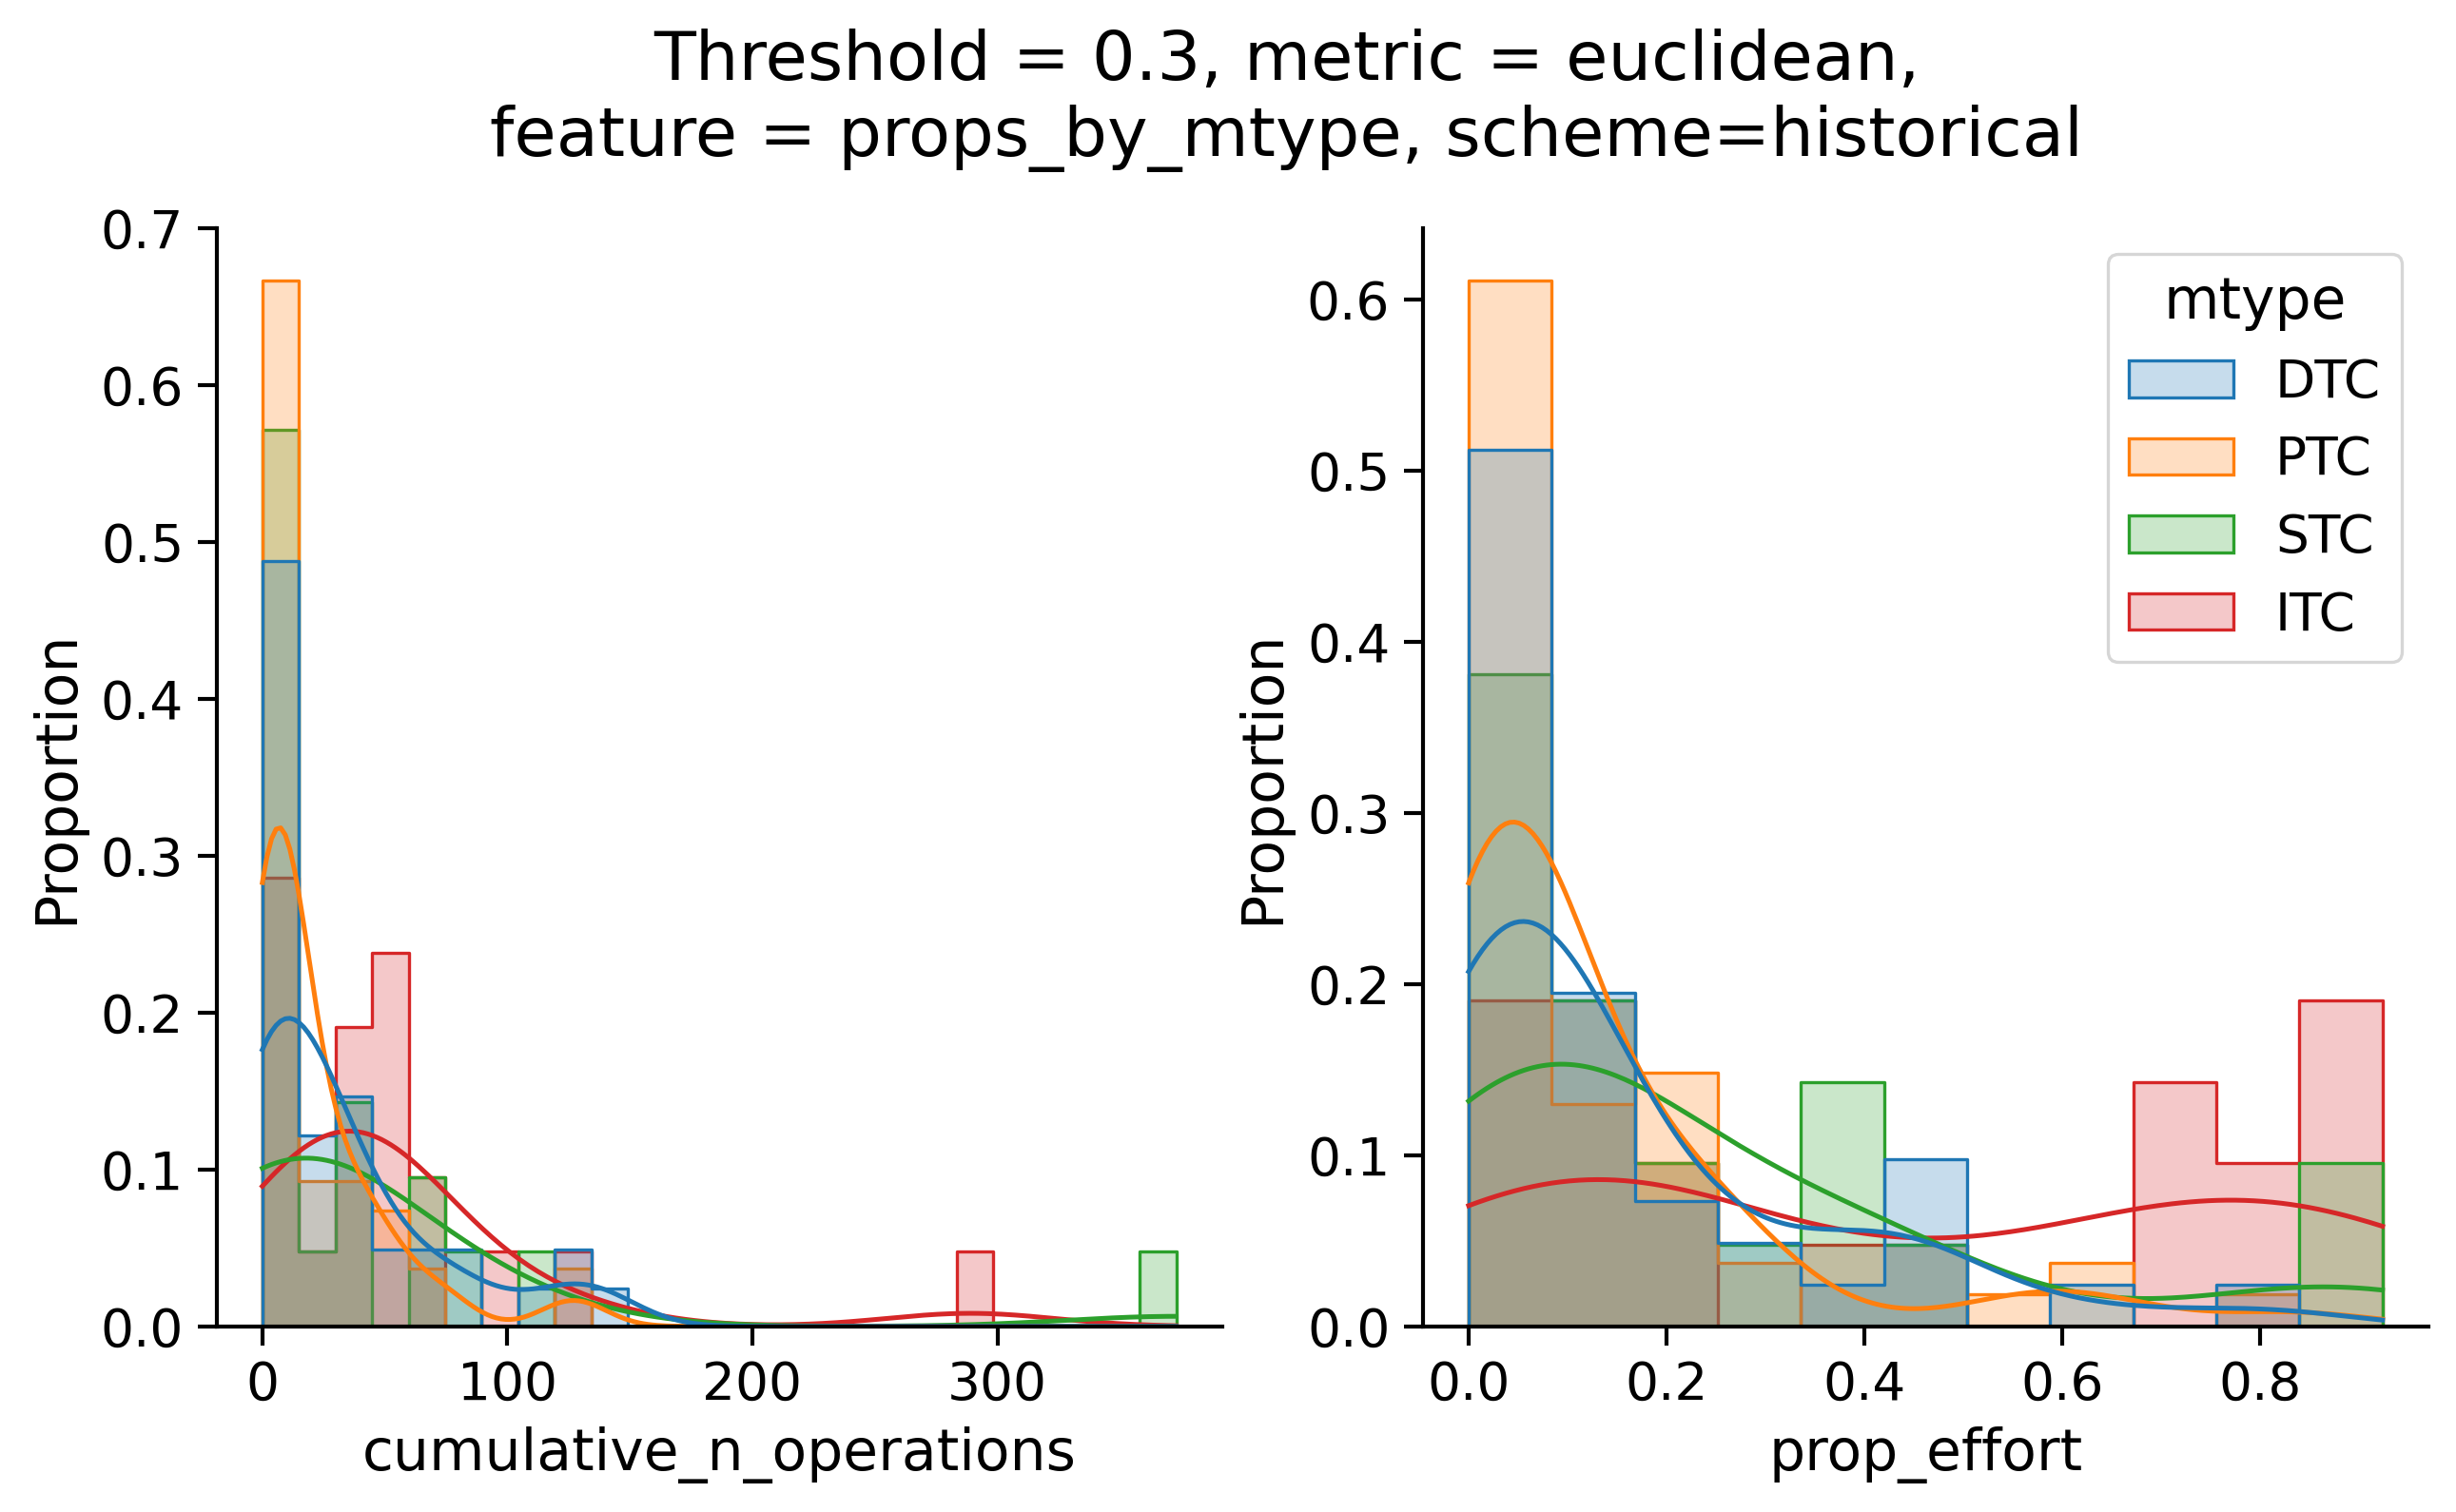
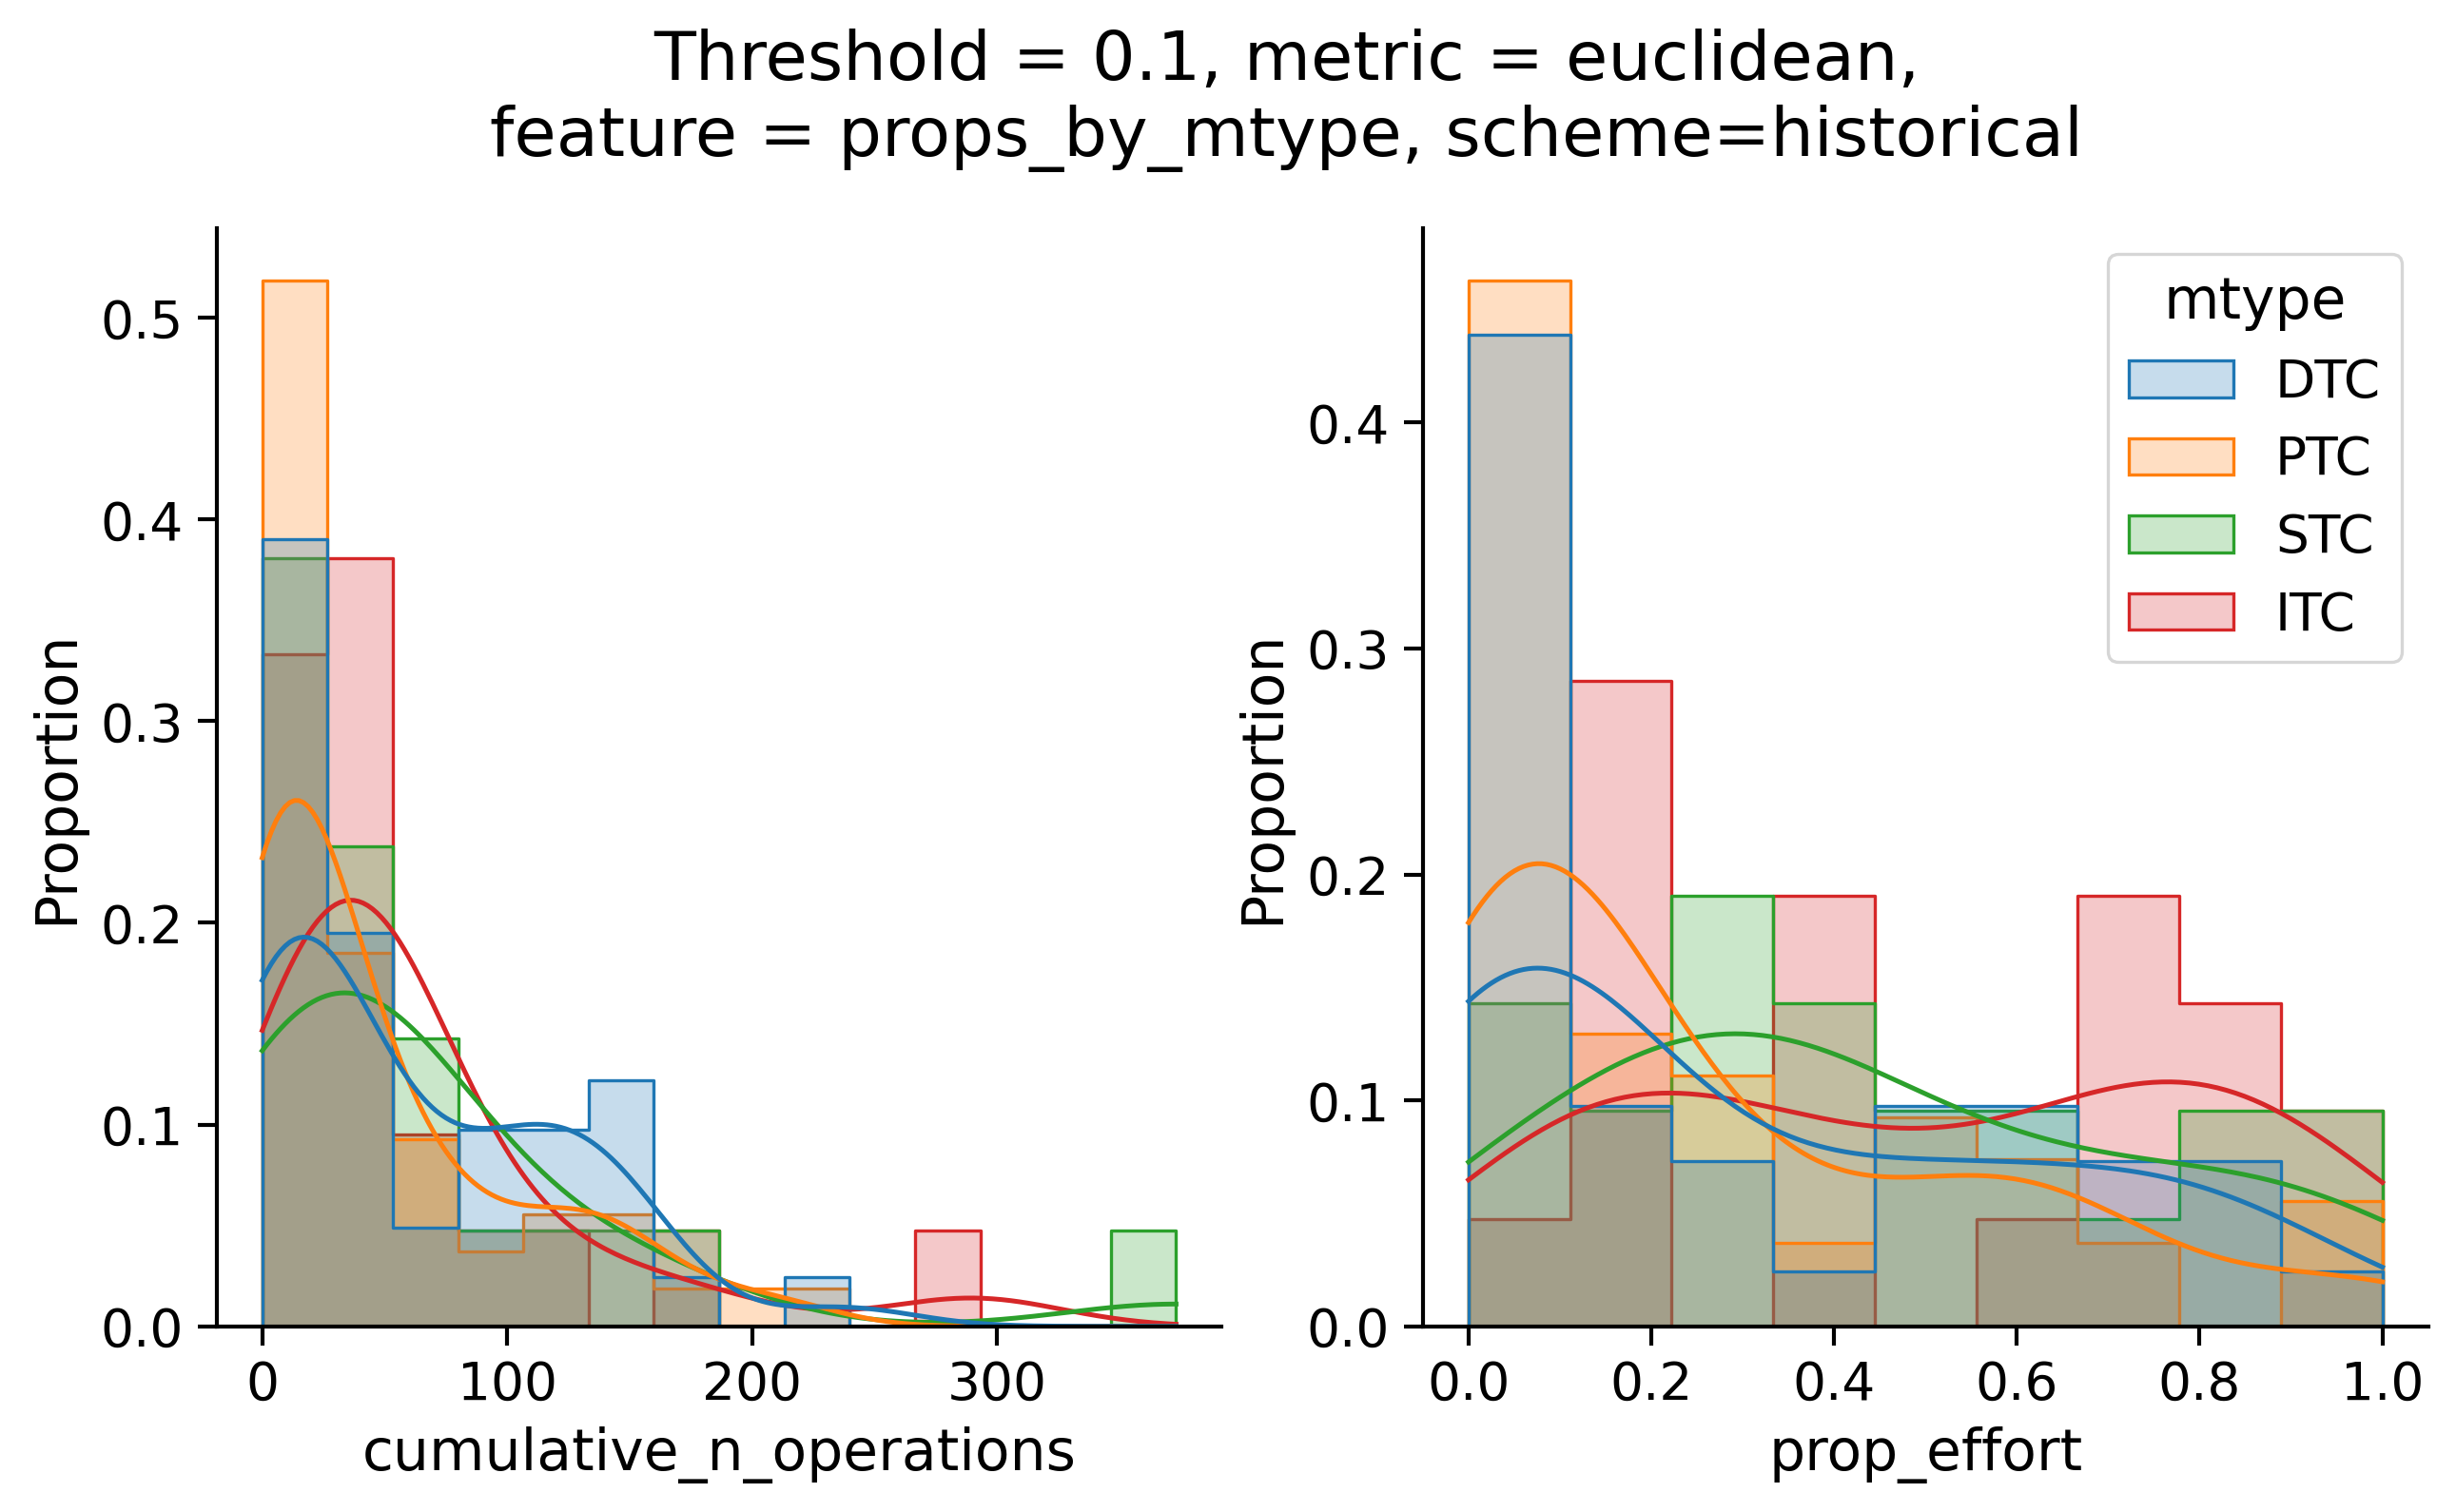
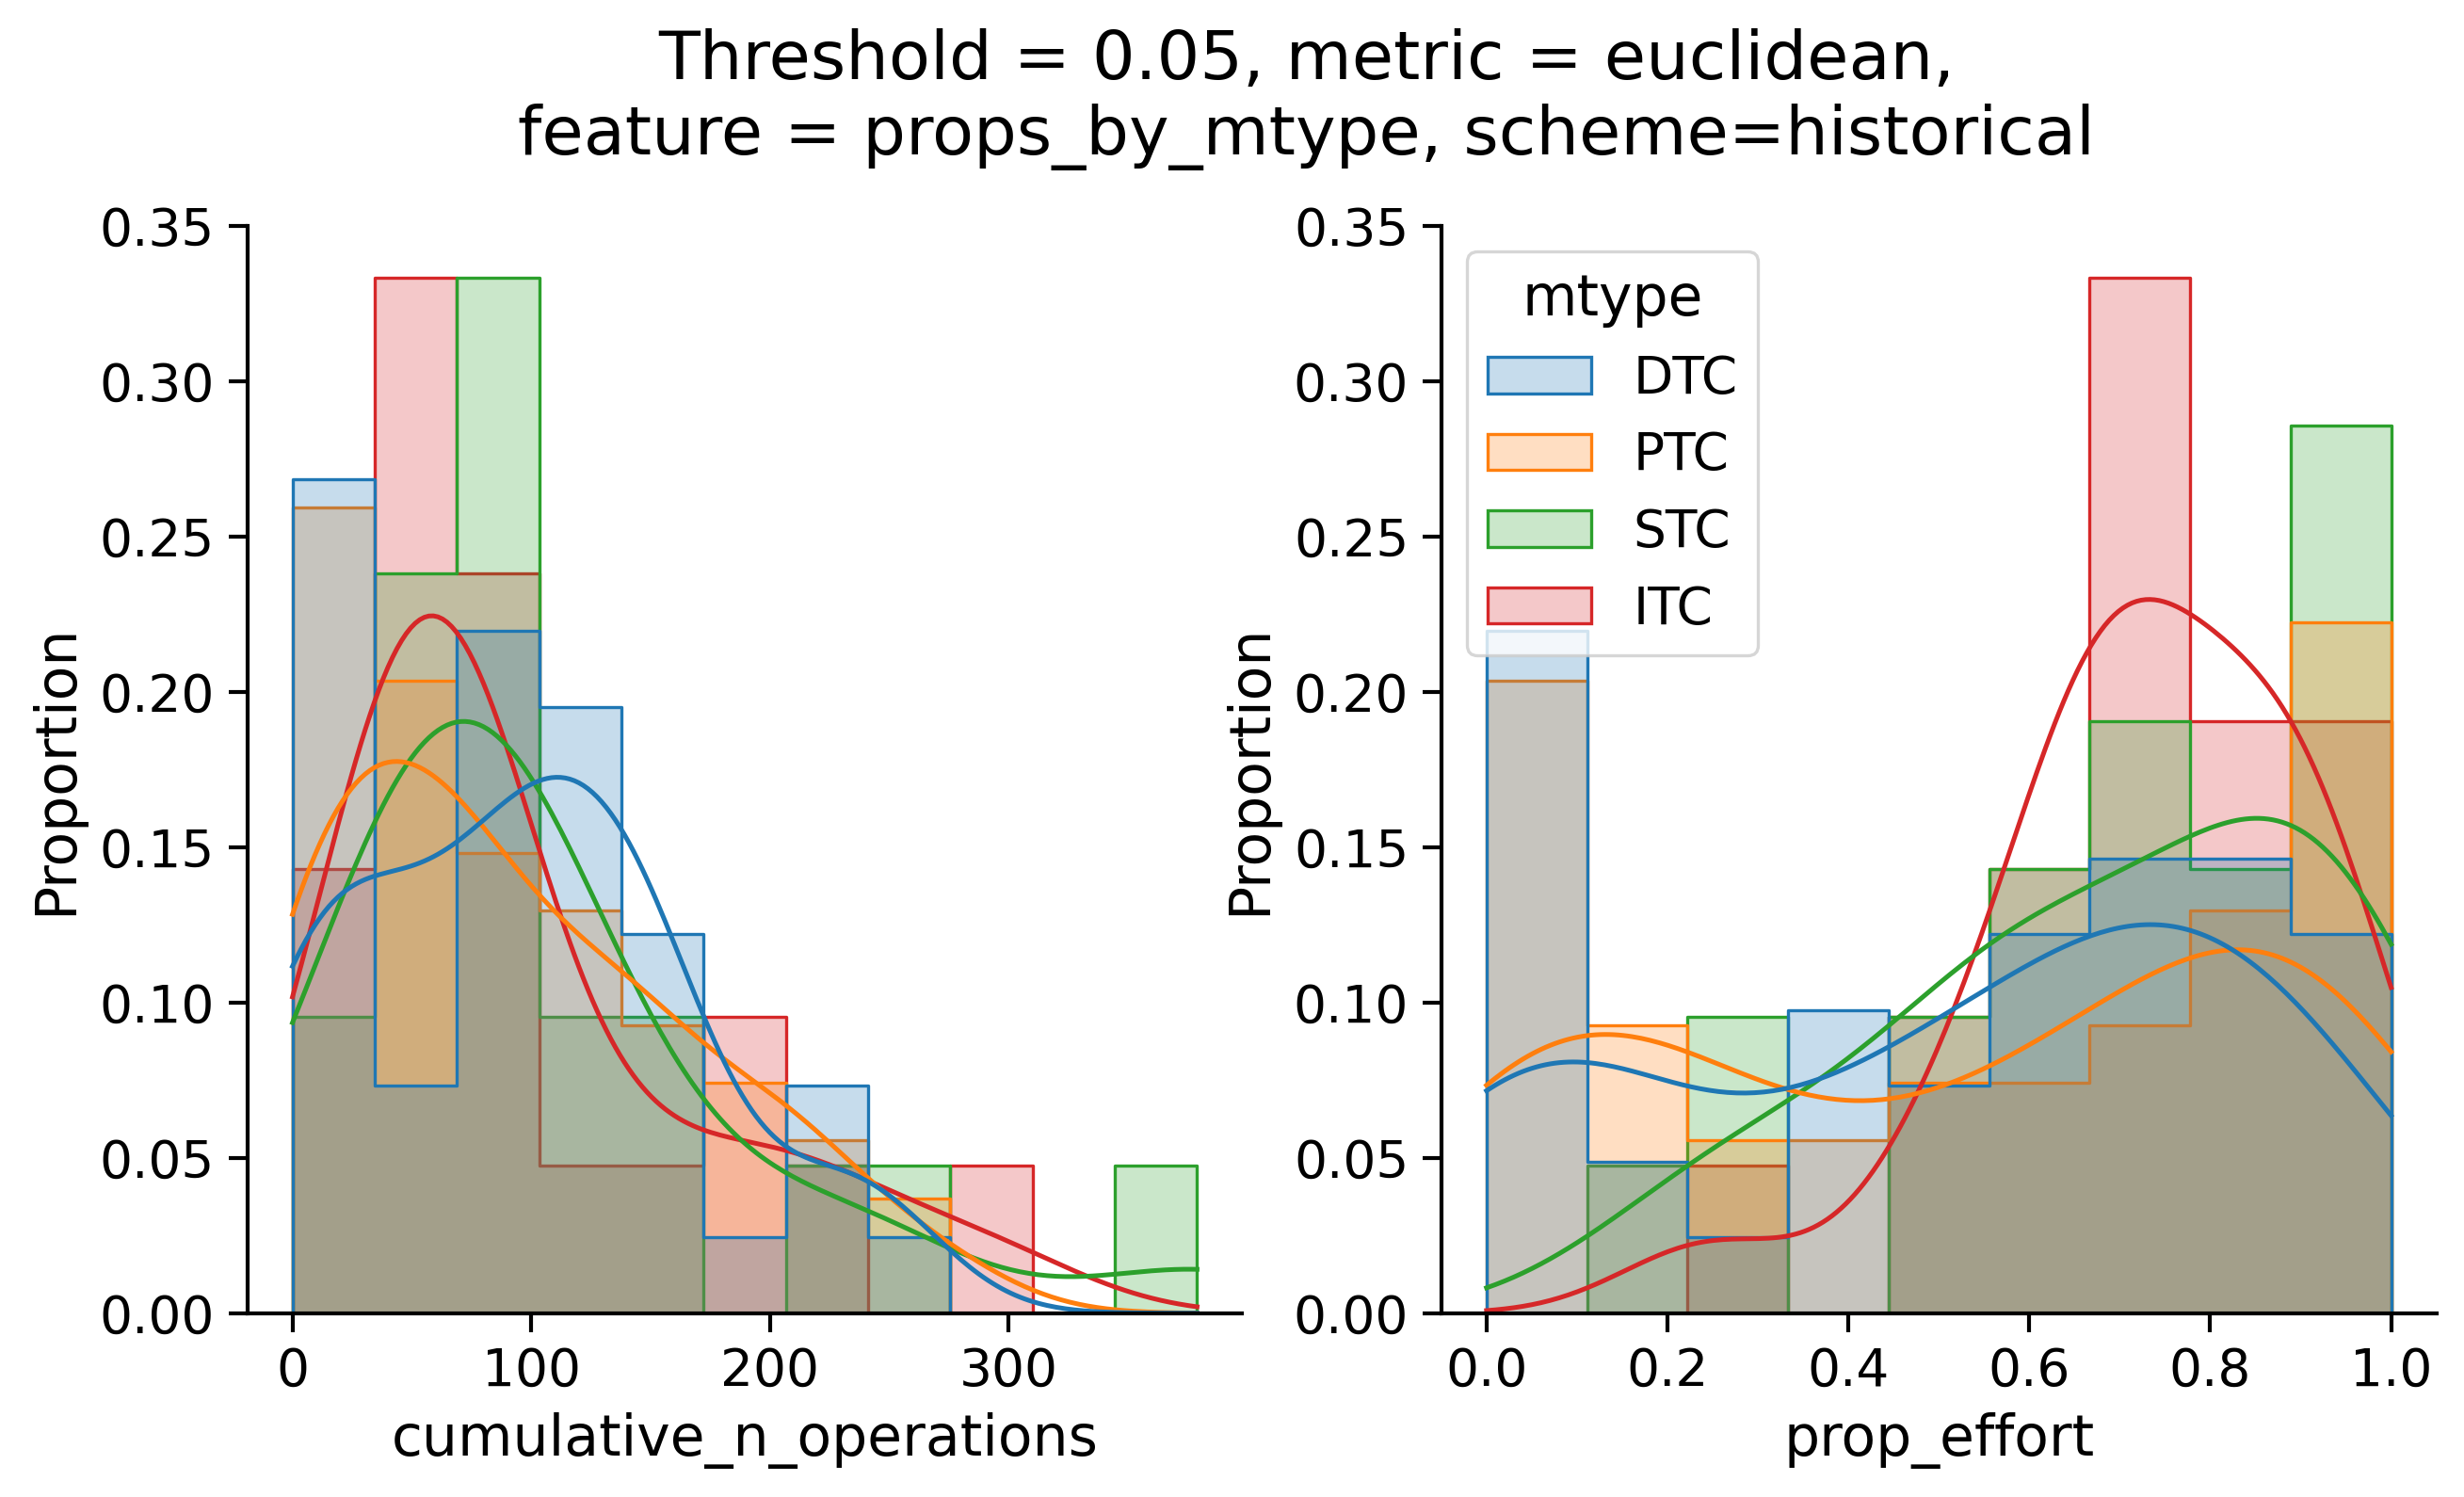
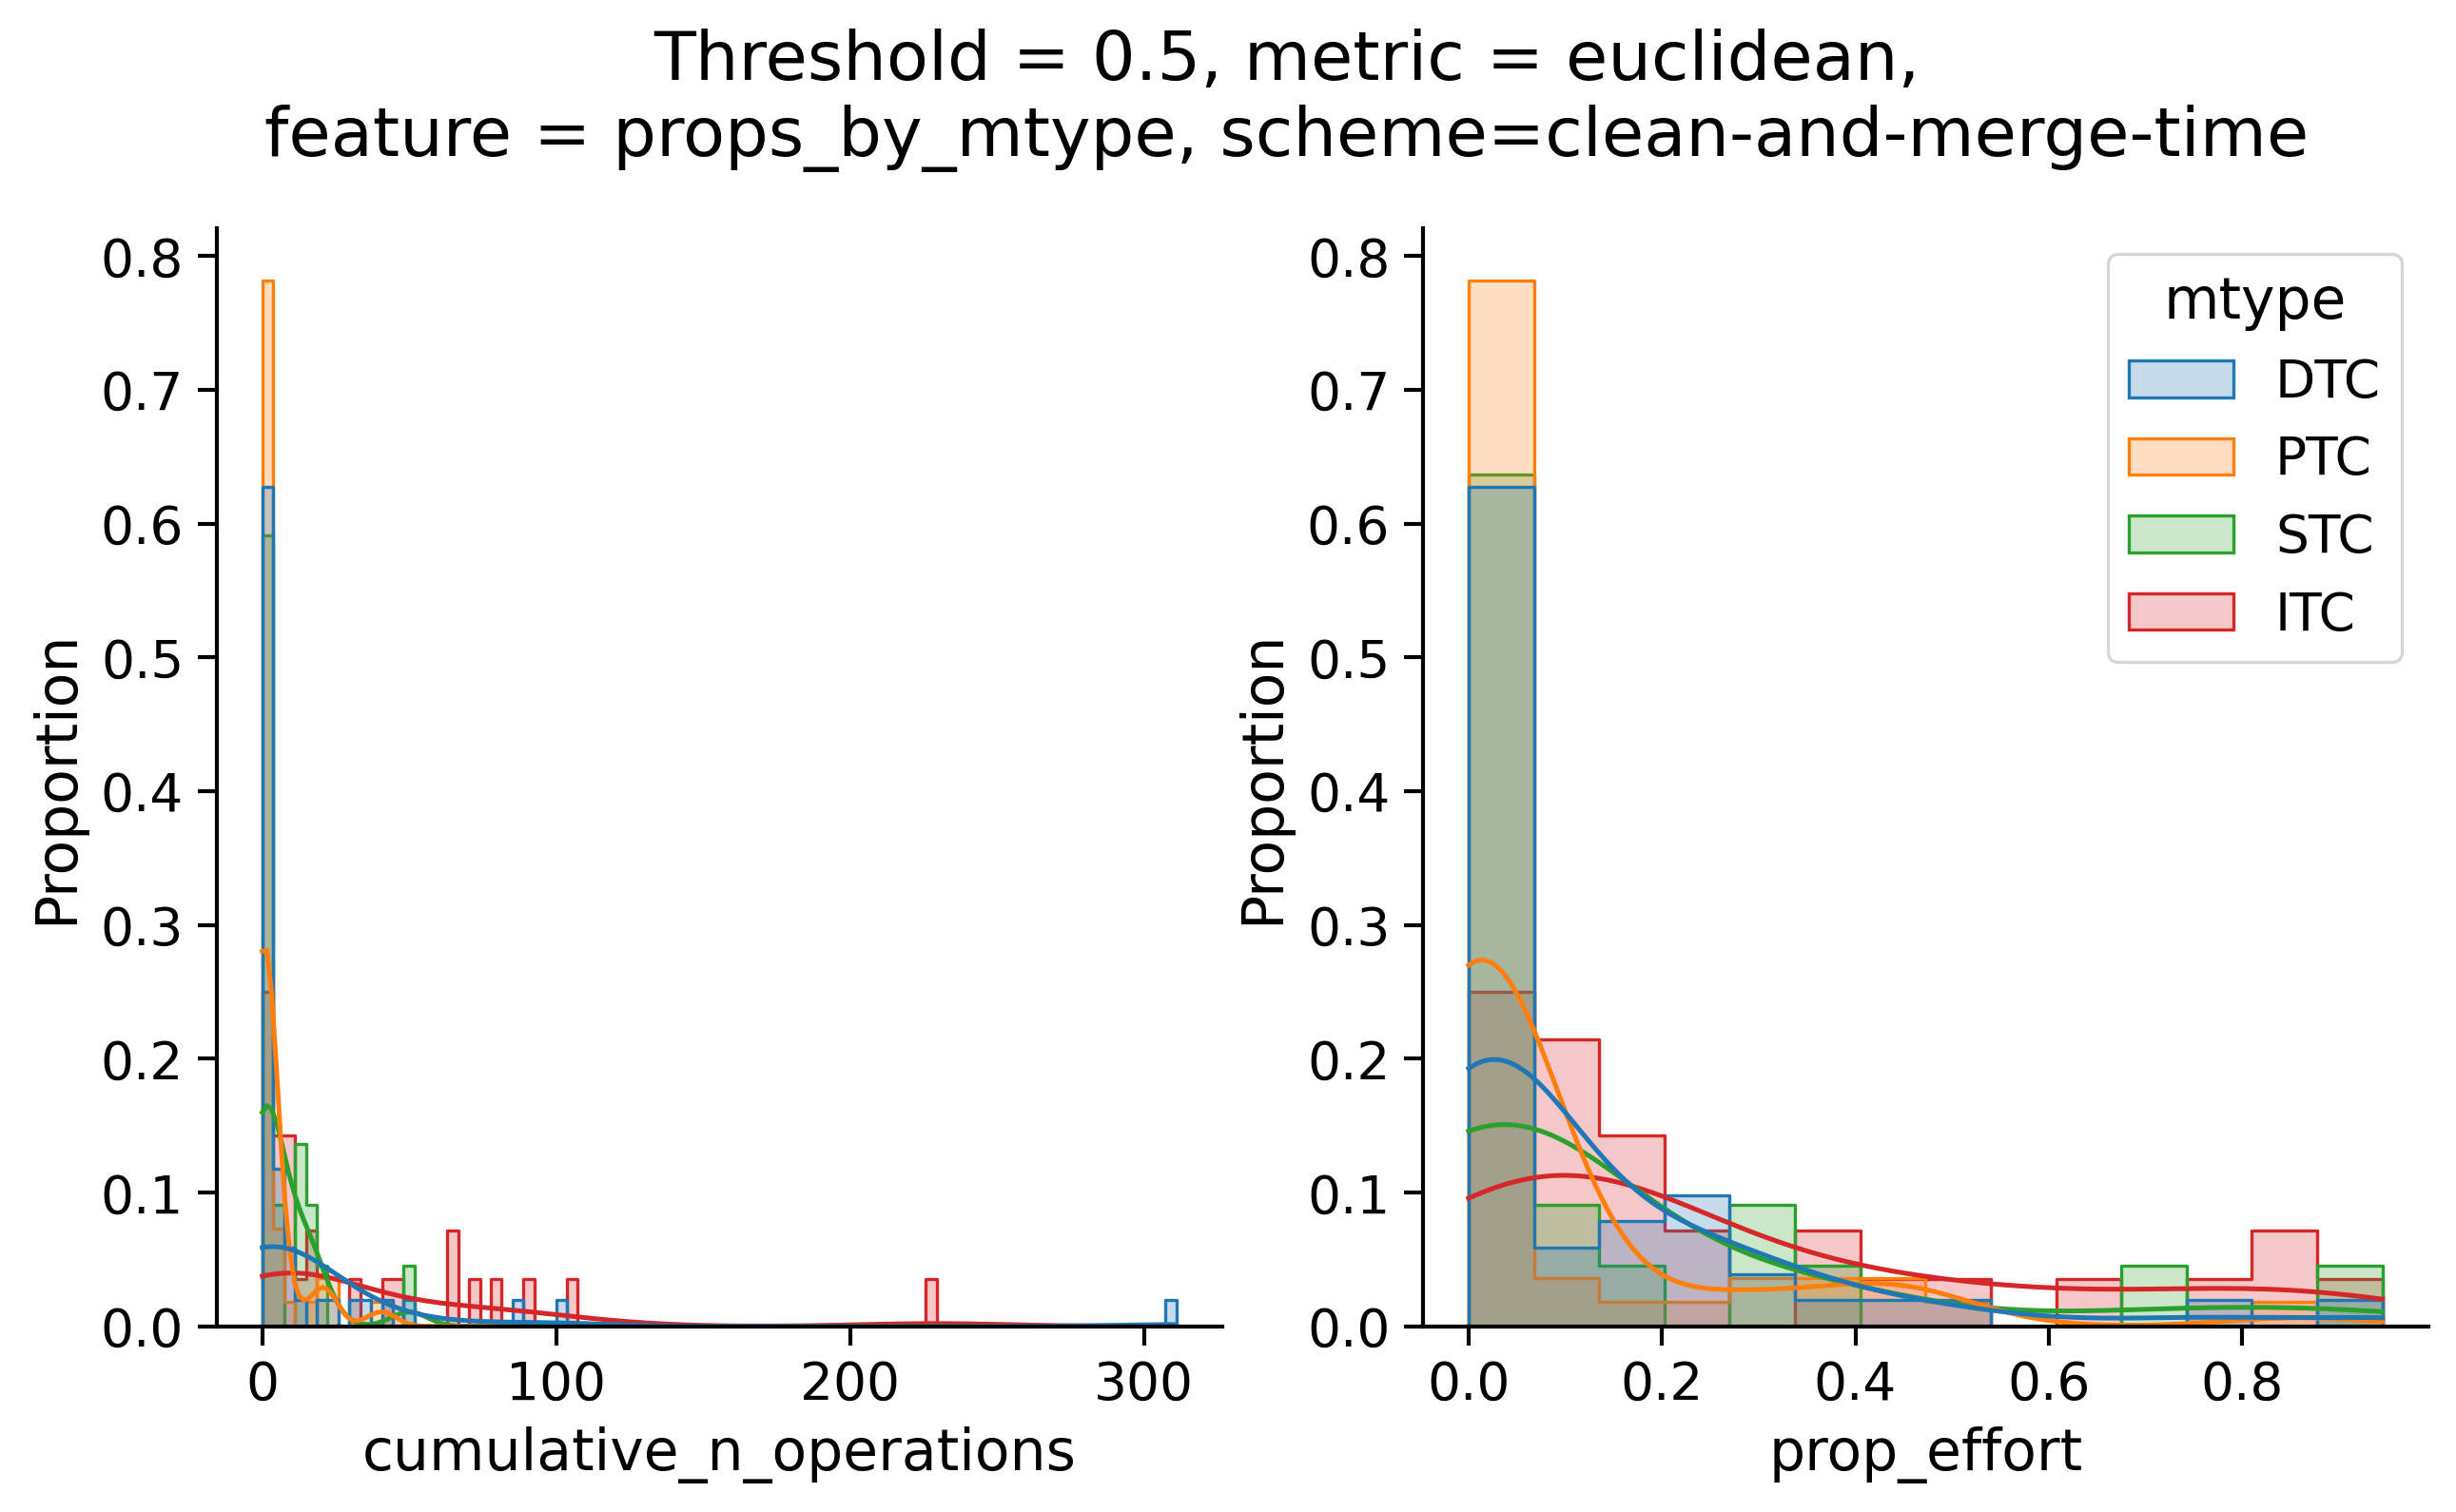
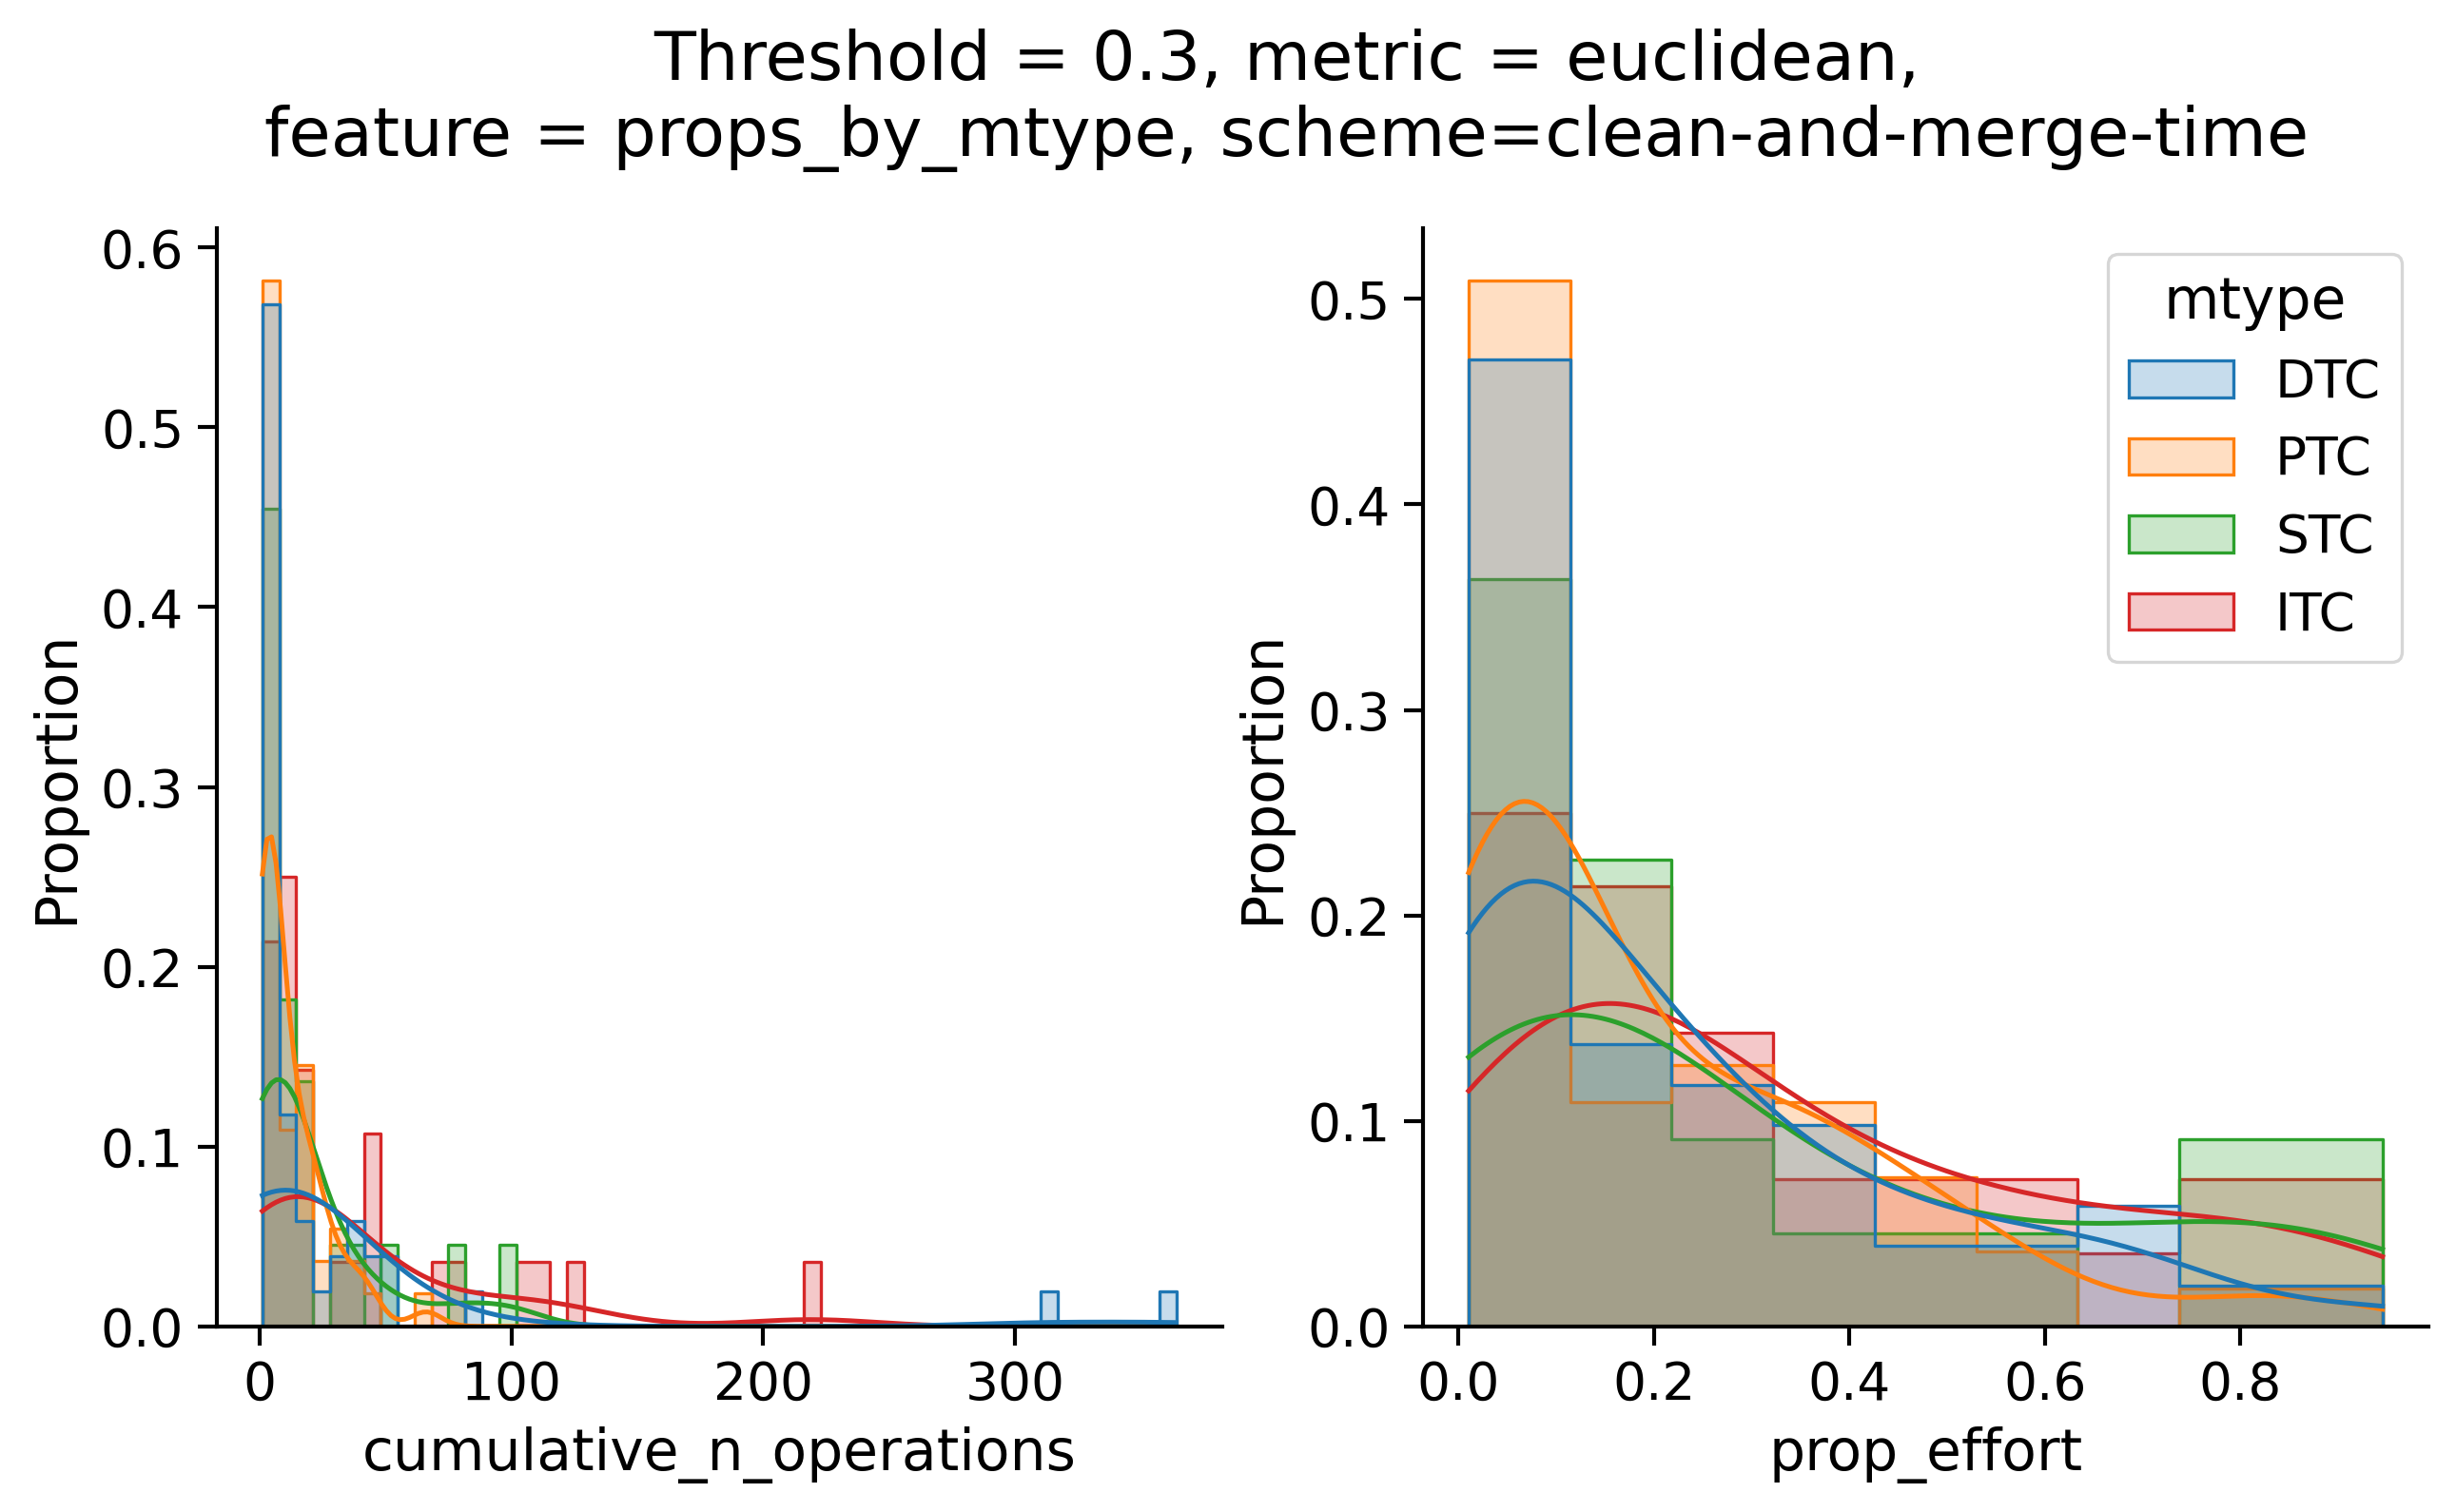
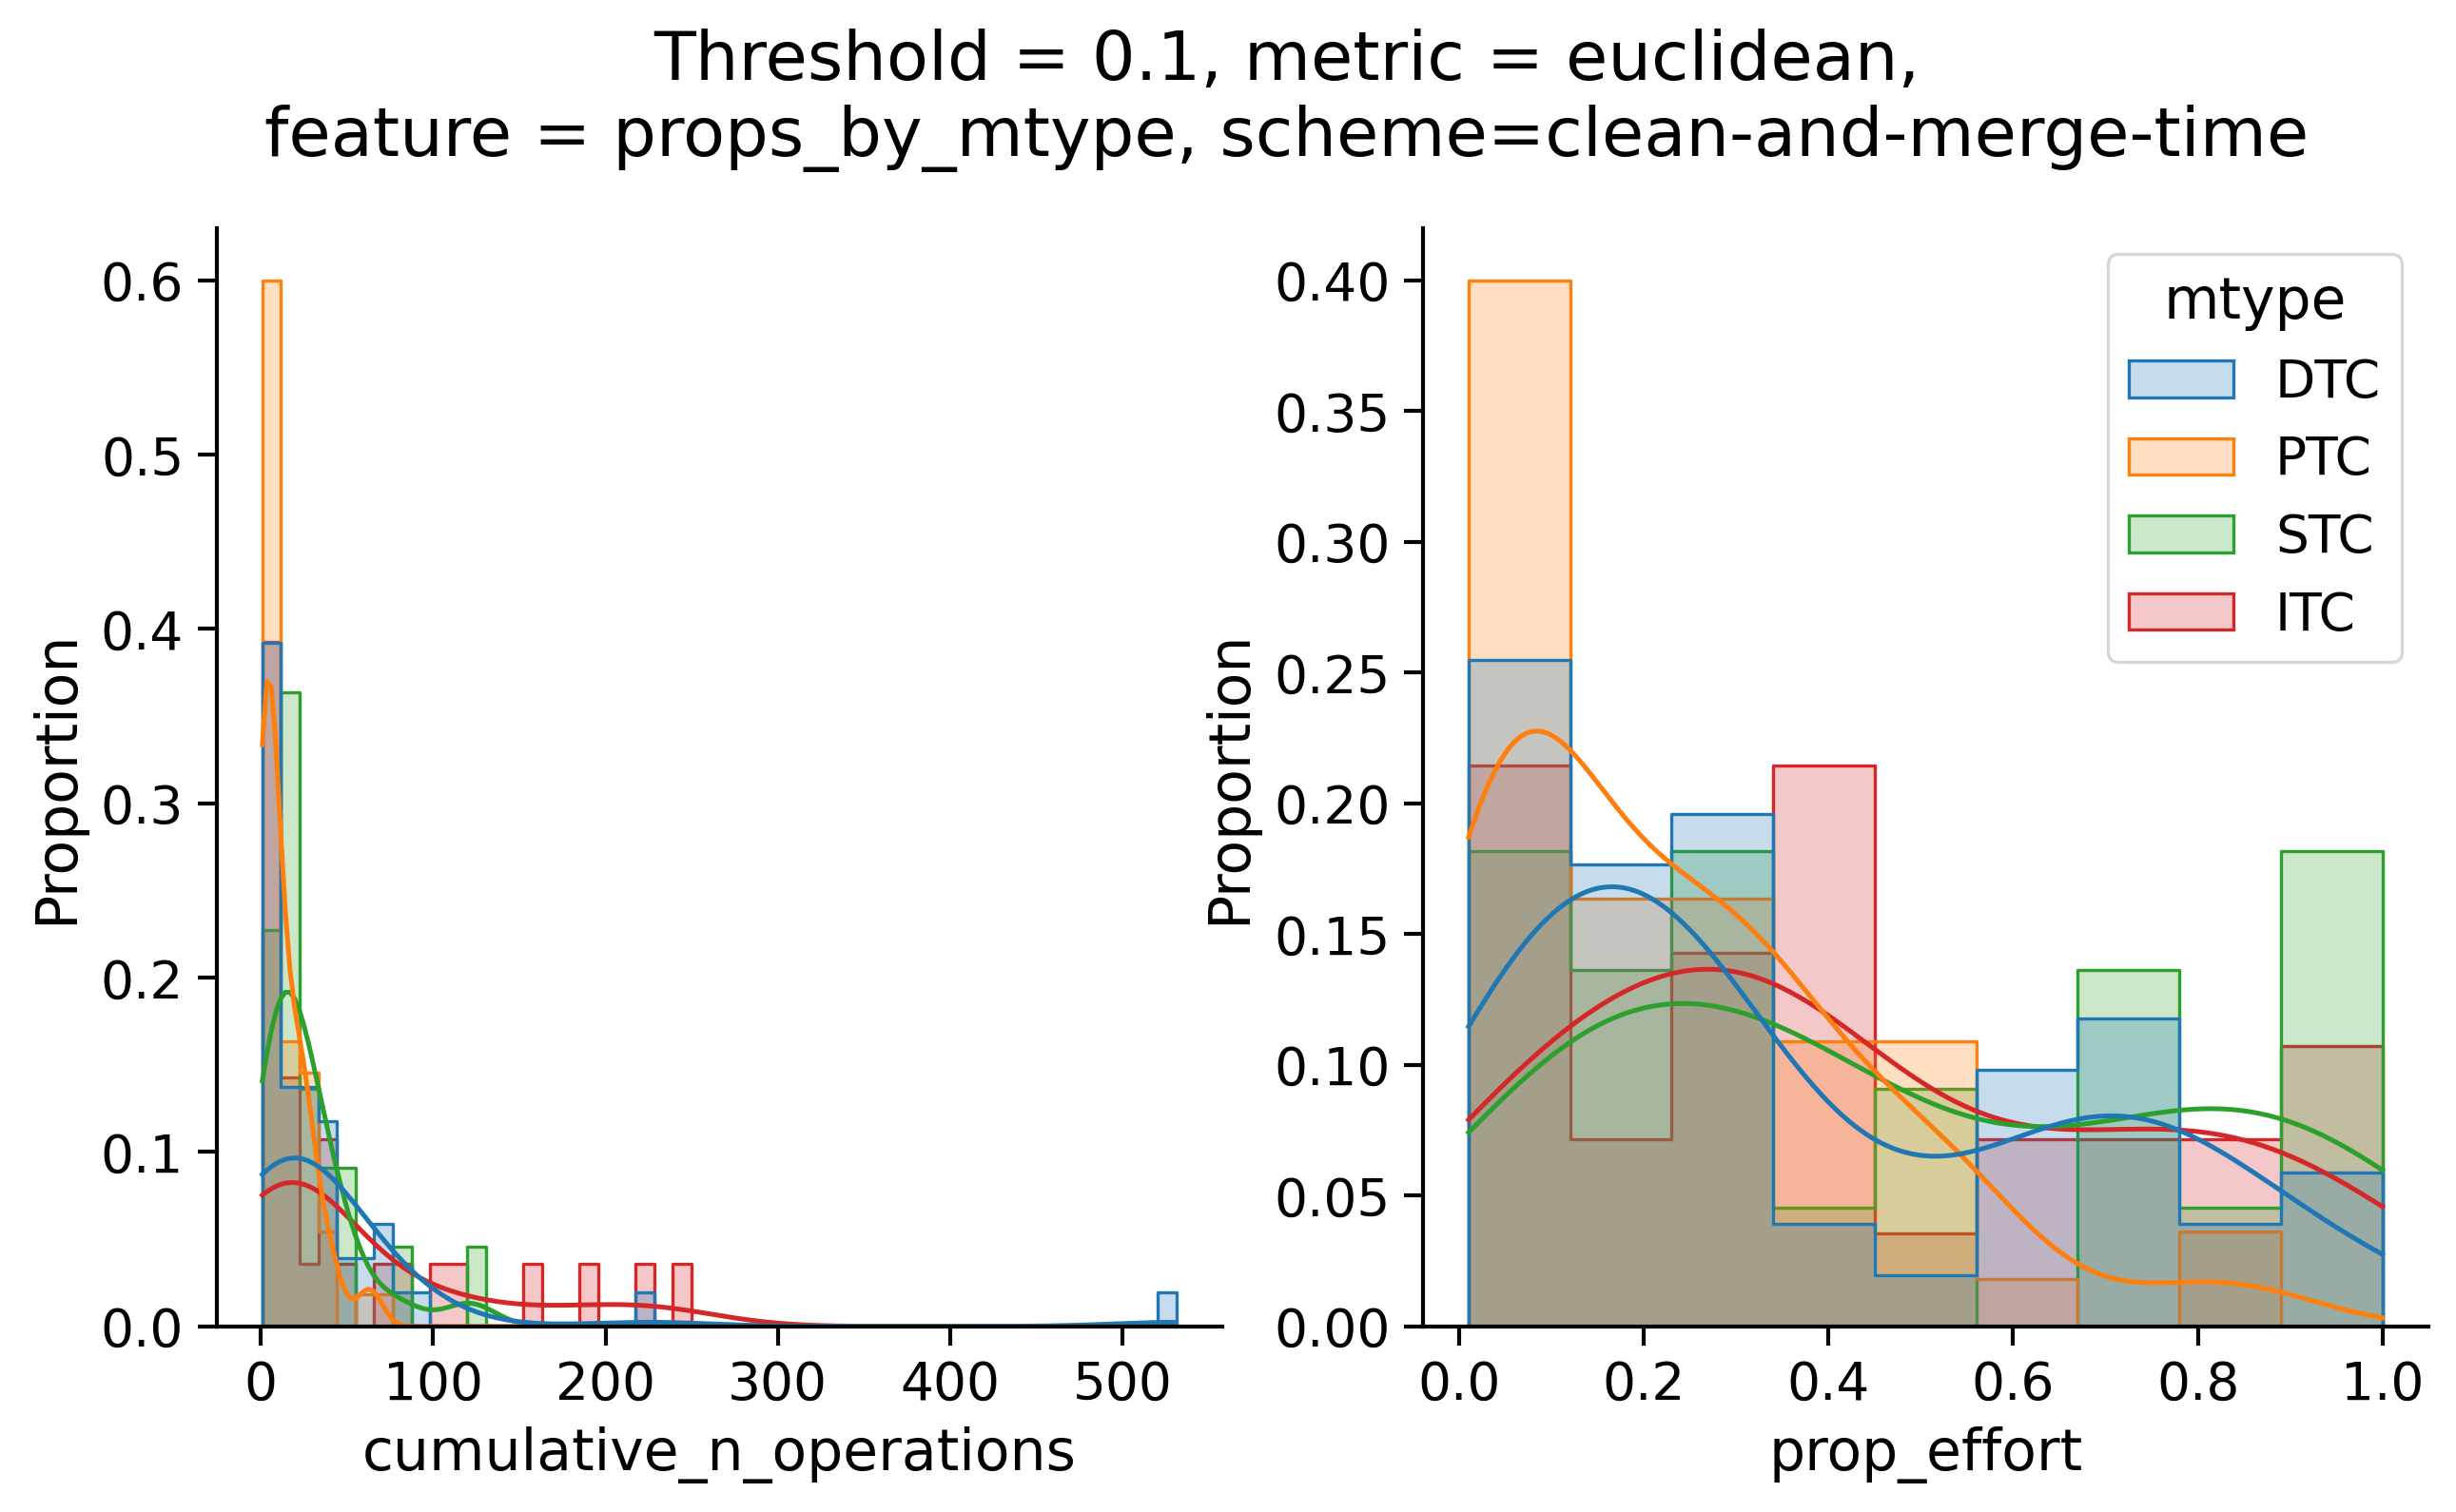
Histograms of time to get within delta
Historical
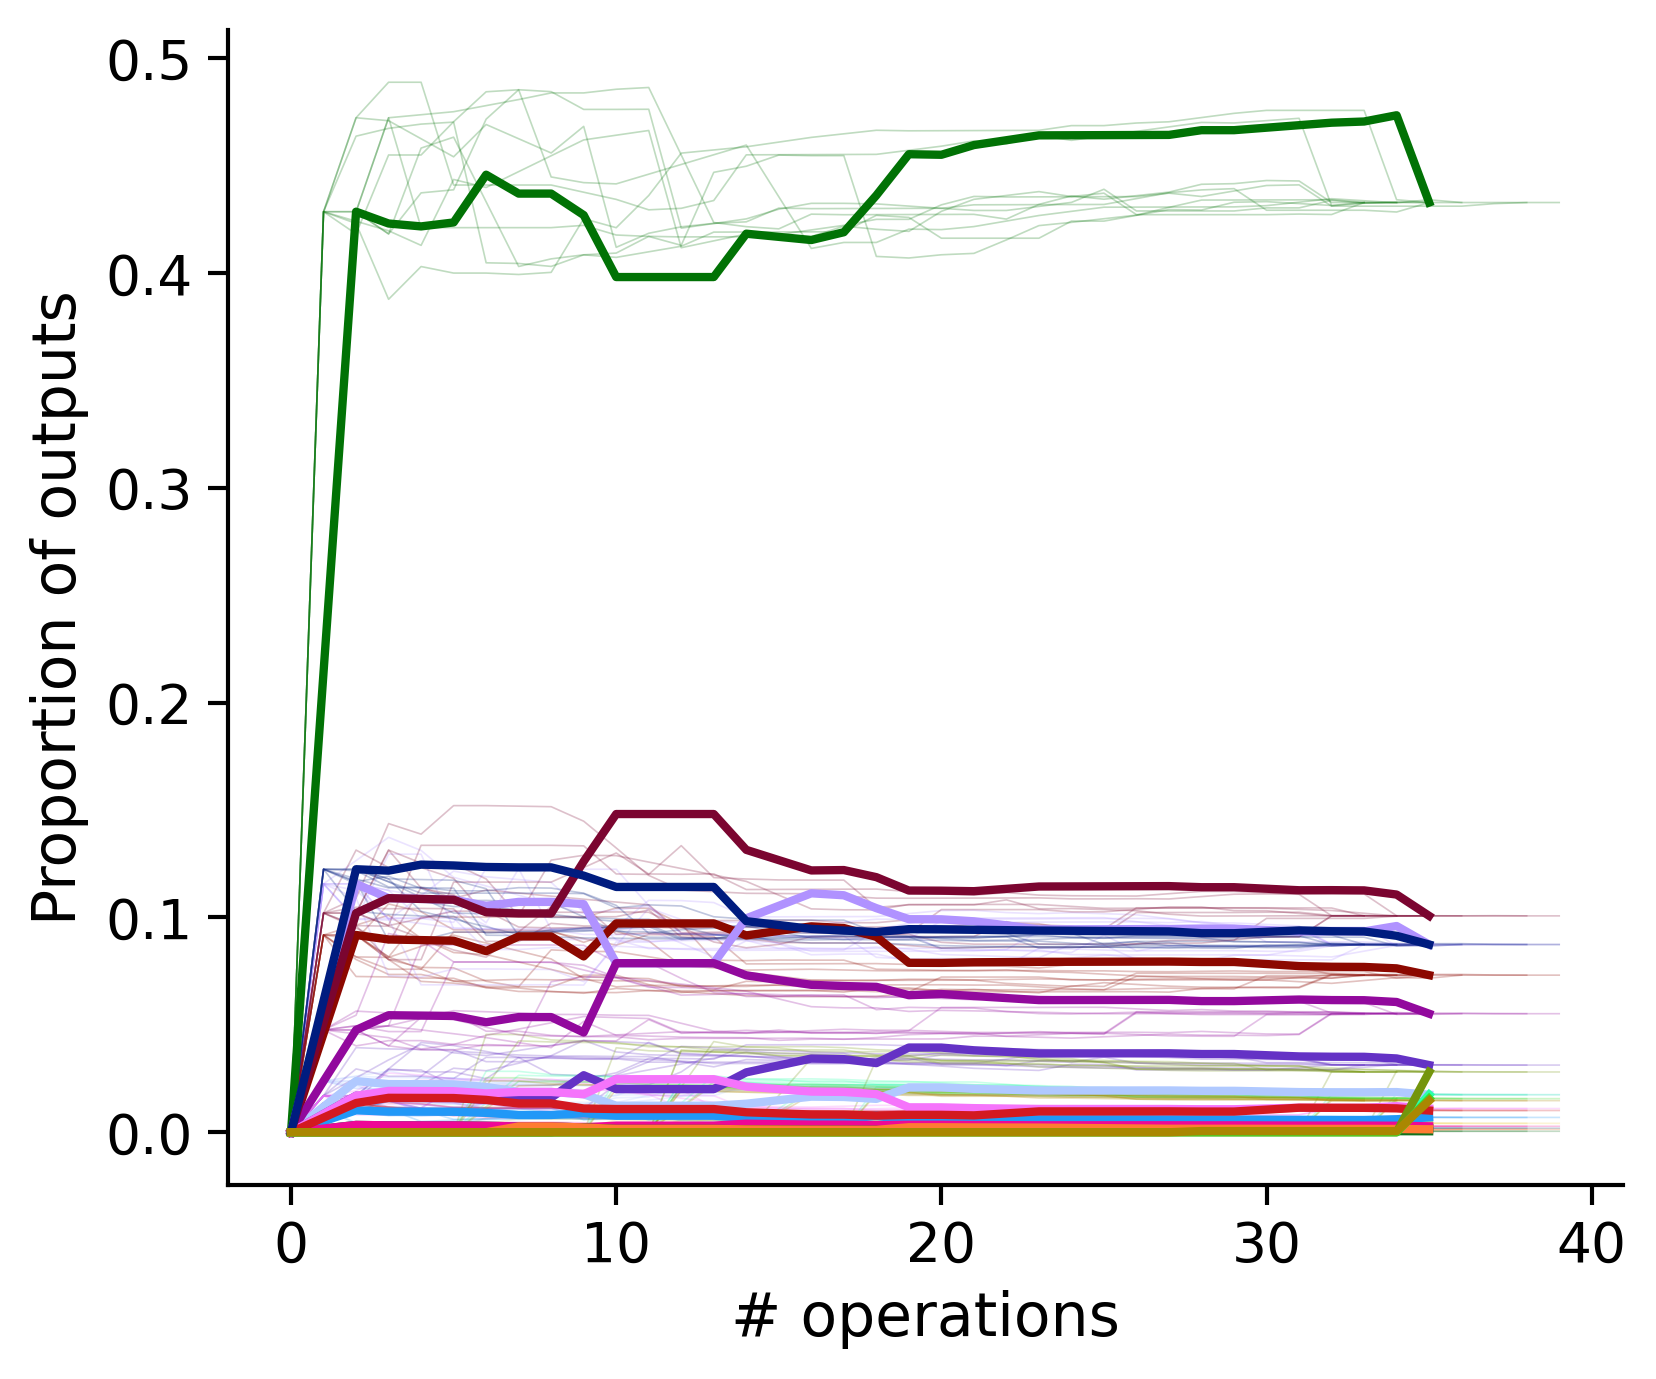
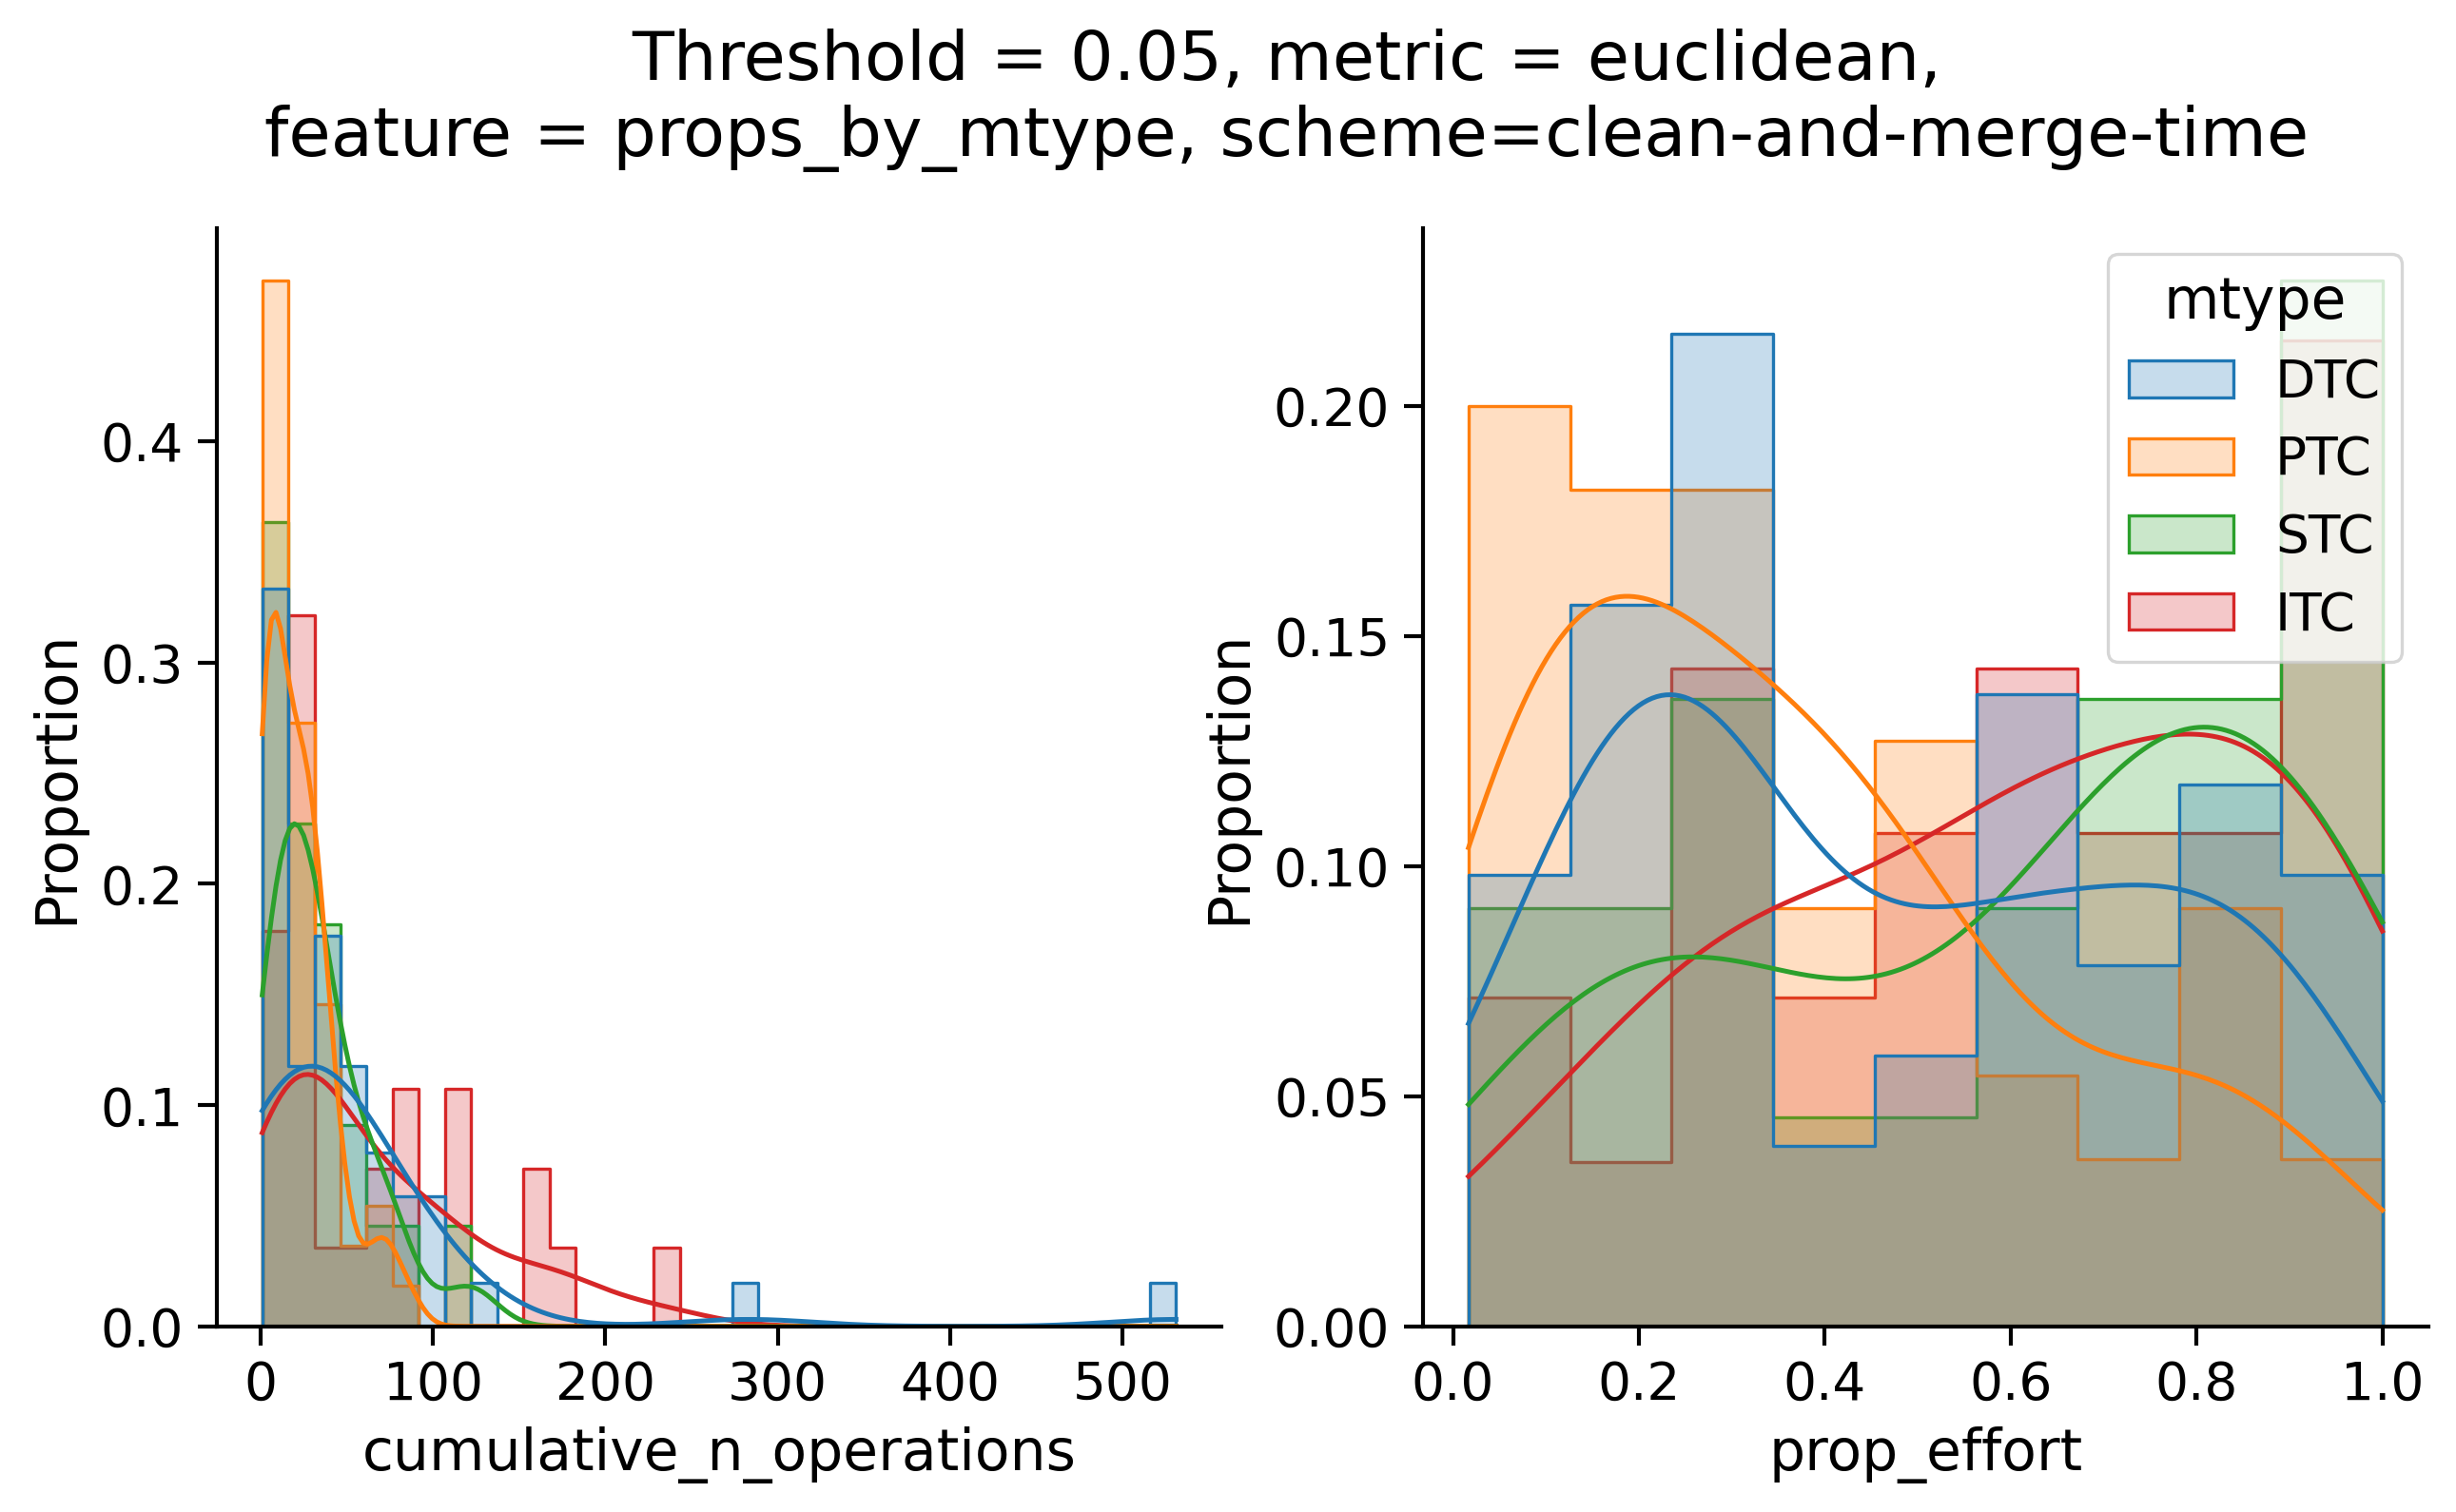
Clean-and-merge by time
Clean-and-merge randomly