Using Joblib and reproducible random numbers
Published:
python
import matplotlib.pyplot as plt
import numpy as np
import pandas as pd
import seaborn as sns
from joblib import Parallel, delayed
from sklearn.cluster import KMeans
from sklearn.datasets import make_blobs
from sklearn.metrics import adjusted_rand_score
from sklearn.mixture import GaussianMixture
Getting random numbers
The following is one of the simplest ways that one could generate many random numbers, which are useful in almost any scientific computing application
np.random.seed(8888)

n_numbers = 20

outs = []
for i in range(n_numbers):
    big_number = np.random.randint(1e8)
    outs.append(big_number)
print(outs)
[28863715, 20470441, 59601088, 35178672, 31953535, 54920184, 6437049, 49557007, 32591667, 33196361, 14963174, 59717179, 32480075, 70590040, 82187373, 67242005, 76389711, 43332706, 66541139, 8632395]
Make the above stuff in my for loop into a function
The first step to getting to something we can do in Joblib is to turn the stuff we had in a for loop into a function
def _get_big_number():
    big_number = np.random.randint(1e8)
    return big_number


np.random.seed(8888)

outs = []
for i in range(n_numbers):
    big_number = _get_big_number()
    outs.append(big_number)

print(outs)
[28863715, 20470441, 59601088, 35178672, 31953535, 54920184, 6437049, 49557007, 32591667, 33196361, 14963174, 59717179, 32480075, 70590040, 82187373, 67242005, 76389711, 43332706, 66541139, 8632395]
Now, do it in parallel
With Joblib, parallelizing the above is super easy!
np.random.seed(8888)
par = Parallel(n_jobs=8)
outs = par(delayed(_get_big_number)() for _ in range(n_numbers))
print(outs)
[49298211, 960679, 7840371, 75202960, 28282479, 7528719, 99466831, 76798086, 61512489, 60087525, 55473392, 85450202, 13124747, 14944763, 92530329, 29784778, 16918058, 67836125, 81264675, 73960372]
But is it reproducible?
np.random.seed(8888)
par = Parallel(n_jobs=8)
outs = par(delayed(_get_big_number)() for _ in range(n_numbers))
print(outs)  # note that now we don't get reproducible results!
[11772194, 70427031, 91672483, 58518373, 42038149, 42933984, 3123949, 96178412, 41251378, 27098387, 98151772, 22073752, 87024182, 39619220, 78539229, 47795066, 77917795, 25815037, 54690881, 72367281]
Get random numbers in parallel, reproducibly
Even when setting the random seed in the above, we did not get reproducible results. To make this happen, I usually just start by generating a long list of random seeds (starting from a random seed, of course) and then pass those seeds down to the individual jobs.
np.random.seed(8888)
seeds = np.random.randint(1e8, size=n_numbers)


def _get_big_reproducible_number(seed):
    np.random.seed(seed)
    return _get_big_number()


par = Parallel(n_jobs=4)
outs = par(delayed(_get_big_reproducible_number)(seed) for seed in seeds)
print(outs)
[46621082, 97292465, 84093849, 69981988, 69717233, 28029841, 53811122, 71335538, 50534020, 6092775, 87017978, 84213854, 7721363, 31245923, 89469332, 30208313, 81965930, 74720508, 80658938, 82125302]
Check that we now get reproducible results
np.random.seed(8888)
seeds = np.random.randint(1e8, size=n_numbers)

par = Parallel(n_jobs=4)
outs = par(delayed(_get_big_reproducible_number)(seed) for seed in seeds)
print(outs)
[46621082, 97292465, 84093849, 69981988, 69717233, 28029841, 53811122, 71335538, 50534020, 6092775, 87017978, 84213854, 7721363, 31245923, 89469332, 30208313, 81965930, 74720508, 80658938, 82125302]
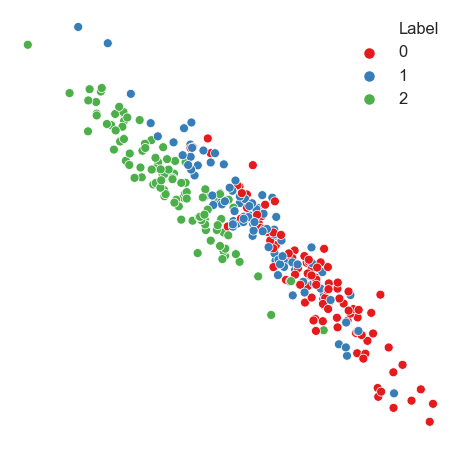
Simple demo with Gaussian blobs
def generate_data(n_samples=300):
    X, y = make_blobs(n_samples=n_samples, cluster_std=2.5)
    transformation = [[0.6, -0.6], [-0.4, 0.8]]
    X_aniso = np.dot(X, transformation)
    aniso = (X_aniso, y)
    return aniso


X, y = generate_data()
plot_df = pd.DataFrame(data=X)
plot_df["Label"] = y

sns.set_context("talk")
fig, ax = plt.subplots(1, 1, figsize=(8, 8))
sns.scatterplot(
    data=plot_df,
    x=0,
    y=1,
    ax=ax,
    hue="Label",
    palette=sns.color_palette("Set1", plot_df["Label"].nunique()),
)
ax.axis("off")
(-8.551714730149058, 7.03254519805067, -5.95587662068765, 12.951742653648202)
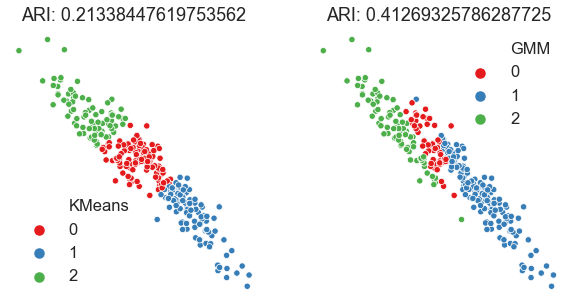
Look at the performance of two different clustering algorithms
Here we’ll just look at a single dataset and see how K-means and GMM perform
gmm = GaussianMixture(n_components=3, covariance_type="full")
gmm_pred_labels = gmm.fit_predict(X)

gmm_ari = adjusted_rand_score(y, gmm_pred_labels)
print(f"GMM ARI:{gmm_ari}")

kmeans = KMeans(n_clusters=3)
kmeans_pred_labels = kmeans.fit_predict(X)
kmeans_ari = adjusted_rand_score(y, kmeans_pred_labels)
print(f"K-means ARI: {kmeans_ari}")

plot_df["KMeans"] = kmeans_pred_labels
plot_df["GMM"] = gmm_pred_labels

fig, axs = plt.subplots(1, 2, figsize=(10, 5))
sns.scatterplot(
    data=plot_df,
    x=0,
    y=1,
    hue="KMeans",
    ax=axs[0],
    palette=sns.color_palette("Set1", plot_df["KMeans"].nunique()),
    s=40,
)
sns.scatterplot(
    data=plot_df,
    x=0,
    y=1,
    hue="GMM",
    ax=axs[1],
    palette=sns.color_palette("Set1", plot_df["KMeans"].nunique()),
    s=40,
)
axs[0].axis("off")
axs[0].set_title(f"ARI: {kmeans_ari}")
axs[1].axis("off")
axs[1].set_title(f"ARI: {gmm_ari}")
GMM ARI:0.41269325786287725
K-means ARI: 0.21338447619753562


Text(0.5, 1.0, 'ARI: 0.41269325786287725')
Now run an actual experiment over many random inits
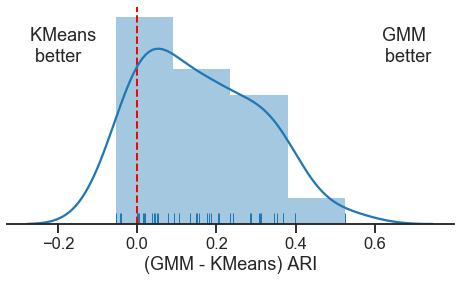
Here is an example of how we could profile the performance of these two algorithms over many random samples using Joblib
def run_experiment(seed):
    np.random.seed(seed)
    X, y = generate_data()

    gmm = GaussianMixture(n_components=3, covariance_type="full", n_init=20)
    gmm_pred_labels = gmm.fit_predict(X)
    gmm_ari = adjusted_rand_score(y, gmm_pred_labels)

    kmeans = KMeans(n_clusters=3, n_init=20)
    kmeans_pred_labels = kmeans.fit_predict(X)
    kmeans_ari = adjusted_rand_score(y, kmeans_pred_labels)

    return gmm_ari - kmeans_ari


np.random.seed(8888)
n_sims = 40
seeds = np.random.randint(1e8, size=n_sims)  # random
# seeds = np.ones(n_sims, dtype=int) # uncomment for not random
par = Parallel(n_jobs=2)
ari_diffs = par(delayed(run_experiment)(seed) for seed in seeds)

fig, ax = plt.subplots(1, 1, figsize=(8, 4))
ax.axvline(0, linewidth=2, linestyle="--", color="red")
sns.distplot(ari_diffs, norm_hist=False)
sns.rugplot(ari_diffs)
xlim = ax.get_xlim()
ylim = ax.get_ylim()
y_range = ylim[1] - ylim[0]
ypos = ylim[0] + y_range * 0.75
x_range = xlim[1] - xlim[0]
ax.text(xlim[0] + 0.05 * x_range, ypos, "KMeans \n better")
ax.text(xlim[1] - 0.05 * x_range, ypos, "GMM \n better", horizontalalignment="right")
ax.spines["left"].set_visible(False)
ax.spines["right"].set_visible(False)
ax.spines["top"].set_visible(False)
ax.set_yticks([])
ax.set_xlabel("(GMM - KMeans) ARI")
Text(0.5, 0, '(GMM - KMeans) ARI')